Automatic Layout and Visualisation of Biclusters
Gregory A. Grothaus, Adeel Mufti, and T. M. Murali
Introduction
Motivation:
Biclustering has emerged as a powerful algorithmic tool for analyzing measurements of gene expression. A number of different methods have emerged for computing biclusters in gene expression data. Many of these algorithms may output a very large number of biclusters with varying degrees of overlap.Results:
We develop a novel algorithm for laying out biclusters in a two-dimensional matrix whose rows (respectively, columns) are rows (respectively, columns) of the original dataset. We display each bicluster as a contiguous submatrix in the layout. We allow the layout to have repeated rows and/or columns from the original matrix as required, but we seek a layout of the smallest size. We also develop a simple web-based search interface for the user to query the layout for genes and samples of interest. We demonstrate the usefulness of our approach on gene expression data for two types of cancer and on protein-DNA binding data for two growth conditions.Software
Current Version
The current version of BiVoC is 1.2, released on Jan 13, 2006.
License
BiVoC is released under the GNU General Public License (GPL). The font used for the GD library when creating bitmapped images is under a slightly different licensing scheme and that license is also included in the distribution. Said simply, the font license allows for unrestricted use of the font unless you take the font and attempt to sell it directly as a stand-alone product. If in doubt, read the license agreements included in the distribution files.
Download and Install
Before installing BiVoC you will need the libGD graphics libraries installed on your computer.
Click the link to download: bivoc-1.2.tar.gz:
$ tar -xvzf bivoc-1.2.tgz $ cd bivoc-1.2 $ ./configure $ make
Now the BiVoC application should be ready to run. If you get any
unresolvable compiler errors, send the text of the errors to us and
we will try to resolve it for you.
Running BiVoC
There are two binaries that must be run in order to use BiVoC. The first is src/layout. To use layout, you need to prepare a bicluster file with the layout file format. The layout file format defines the biclusters to be displayed, one per line. The format for each line is:
<bicluster name>_<# of columns>_<# of
rows> <color, generally black> <column
names tab delimited> <row names tab delimited>
The bicluster name strings should be unique. The elements are all tab separated, allowing row and column names with spaces in them. For example purposes, use a simple example file found at examples/allaml/allaml-3.txt
$ src/layout -o examples/allaml/allaml-3.layout examples/allaml/allaml-3.txt
Now you will have created a layout file called allaml-3.layout which stores the row/column orderings of the approximate optimal layout. This file will be used by the drawlayout binary to produce an actual image to your specifications. The second binary, drawlayout needs the allaml-3.layout file that was just created as well as the original microarray data file. The expected format of the microarray data file is a tab delimited 2 dimensional array with columns representing samples and rows representing genes. We will use the MicroArray data file examples/allaml/ALL-AML-all-no-name.txt. To create a postscript image using the default parameters, run:
$ src/drawlayout -o allaml-3.ps -a examples/allaml/ALL-AML-all-no-name.txt examples/allaml/allaml-3.layout
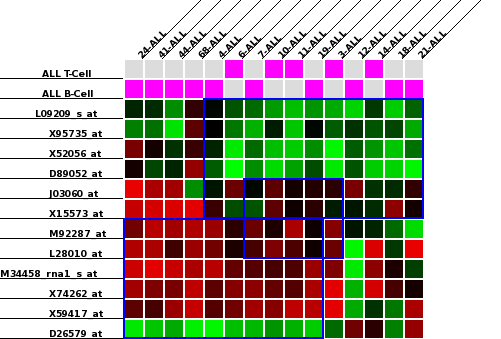
If you would like to display the classes associated with the samples in question run:
$ src/drawlayout -o allaml-3.ps -a examples/allaml/ALL-AML-all-no-name.txt examples/allaml/allaml-3.layout -classes examples/allaml/classConvert.txt
The resulting image should look similar to the following:
Command Line Options
To see all parameters for both binaries, run them with a -h command-line flag. The drawlayout binary is the only one that has optional command line parameters:
Option Parameter Type Description -o filename Specify output image file. -a filename Specify Microarray data file. -startSamples integer Specify Number of columns before the first data column(default=1). -nameColumn integer Specify Number of columns before the column specifying the row names (default=0). -sizeModifier real Multiply all dimensions by this value. A value of 2 would make the image twice as tall and twice as wide, effectively quadrupling it's area. -width real Multiply bicluster line width by this value in order to make the boxes easier to see. -cr filename Tab Delimited file replaces all columns names in the first column of the file with the column names in the second column of the file. -rr filename Tab Delimited file replaces all row names in the first column of the file with the row names in the second column of the file. -binary none Lets drawlayout know that the microarray input file is binary, not real valued, draws heat diagram colors accordingly. -colors none Draws the bicluster boxes in the color specified in the microarray file(only red,green,blue,black supported). -showColumns none Show all columns in the expression file regardless of their presence in a bicluster. -showRows none Show all rows in the expression file regardless of their presence in a bicluster. -classes filename Displays the classes of the samples as specified in the file. -t string Specify an output image format. Options are ps,png,gif. ps is the default.