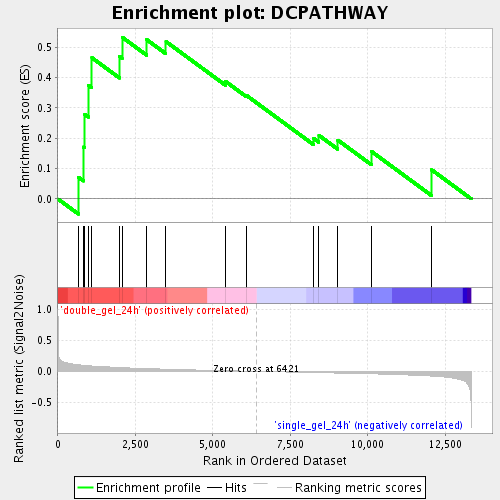
Profile of the Running ES Score & Positions of GeneSet Members on the Rank Ordered List
| Dataset | double_gel_and_single_gel_rma_expression_values_collapsed_to_symbols.class.cls #double_gel_24h_versus_single_gel_24h.class.cls #double_gel_24h_versus_single_gel_24h_repos |
| Phenotype | class.cls#double_gel_24h_versus_single_gel_24h_repos |
| Upregulated in class | double_gel_24h |
| GeneSet | DCPATHWAY |
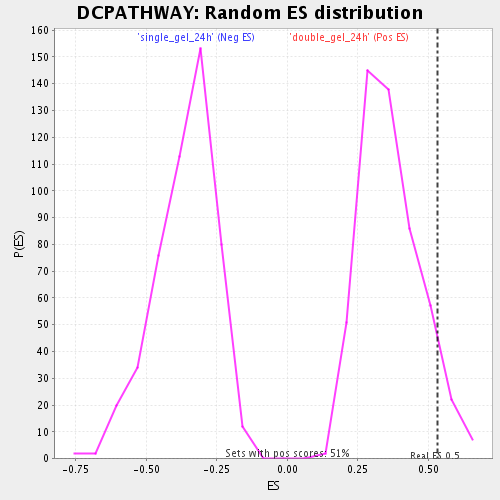
| Enrichment Score (ES) | 0.53321296 |
| Normalized Enrichment Score (NES) | 1.463939 |
| Nominal p-value | 0.06692913 |
| FDR q-value | 0.2907029 |
| FWER p-Value | 1.0 |
| PROBE | GENE SYMBOL | GENE_TITLE | RANK IN GENE LIST | RANK METRIC SCORE | RUNNING ES | CORE ENRICHMENT | |
|---|---|---|---|---|---|---|---|
| 1 | ANPEP | ANPEP Entrez, Source | alanyl (membrane) aminopeptidase (aminopeptidase N, aminopeptidase M, microsomal aminopeptidase, CD13, p150) | 665 | 0.106 | 0.0710 | Yes |
| 2 | IL4 | IL4 Entrez, Source | interleukin 4 | 824 | 0.098 | 0.1714 | Yes |
| 3 | IL3 | IL3 Entrez, Source | interleukin 3 (colony-stimulating factor, multiple) | 866 | 0.097 | 0.2786 | Yes |
| 4 | IFNG | IFNG Entrez, Source | interferon, gamma | 983 | 0.092 | 0.3747 | Yes |
| 5 | IL12B | IL12B Entrez, Source | interleukin 12B (natural killer cell stimulatory factor 2, cytotoxic lymphocyte maturation factor 2, p40) | 1097 | 0.087 | 0.4656 | Yes |
| 6 | IFNB1 | IFNB1 Entrez, Source | interferon, beta 1, fibroblast | 1990 | 0.063 | 0.4703 | Yes |
| 7 | CD2 | CD2 Entrez, Source | CD2 molecule | 2074 | 0.061 | 0.5332 | Yes |
| 8 | IFNA1 | IFNA1 Entrez, Source | interferon, alpha 1 | 2866 | 0.045 | 0.5252 | No |
| 9 | TLR4 | TLR4 Entrez, Source | toll-like receptor 4 | 3487 | 0.035 | 0.5190 | No |
| 10 | IL10 | IL10 Entrez, Source | interleukin 10 | 5413 | 0.011 | 0.3873 | No |
| 11 | CSF2 | CSF2 Entrez, Source | colony stimulating factor 2 (granulocyte-macrophage) | 6070 | 0.004 | 0.3425 | No |
| 12 | IL13 | IL13 Entrez, Source | interleukin 13 | 8256 | -0.018 | 0.1995 | No |
| 13 | TLR2 | TLR2 Entrez, Source | toll-like receptor 2 | 8424 | -0.020 | 0.2097 | No |
| 14 | IL5 | IL5 Entrez, Source | interleukin 5 (colony-stimulating factor, eosinophil) | 9032 | -0.026 | 0.1942 | No |
| 15 | CD5 | CD5 Entrez, Source | CD5 molecule | 10124 | -0.039 | 0.1563 | No |
| 16 | IL12A | IL12A Entrez, Source | interleukin 12A (natural killer cell stimulatory factor 1, cytotoxic lymphocyte maturation factor 1, p35) | 12062 | -0.075 | 0.0960 | No |