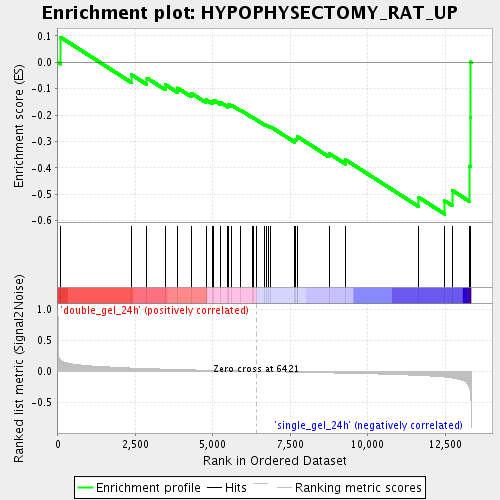
Profile of the Running ES Score & Positions of GeneSet Members on the Rank Ordered List
| Dataset | double_gel_and_single_gel_rma_expression_values_collapsed_to_symbols.class.cls #double_gel_24h_versus_single_gel_24h.class.cls #double_gel_24h_versus_single_gel_24h_repos |
| Phenotype | class.cls#double_gel_24h_versus_single_gel_24h_repos |
| Upregulated in class | single_gel_24h |
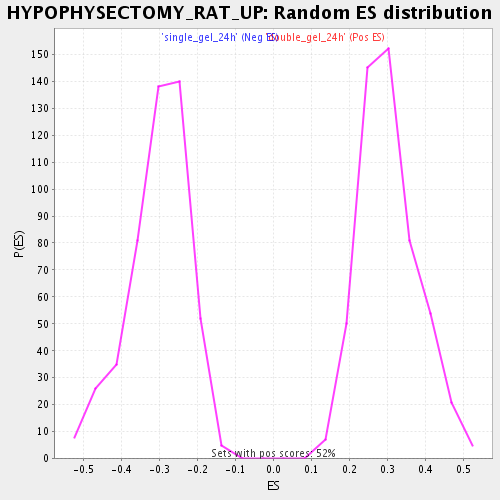
| GeneSet | HYPOPHYSECTOMY_RAT_UP |
| Enrichment Score (ES) | -0.57475114 |
| Normalized Enrichment Score (NES) | -1.8992068 |
| Nominal p-value | 0.0 |
| FDR q-value | 0.093516245 |
| FWER p-Value | 0.74 |
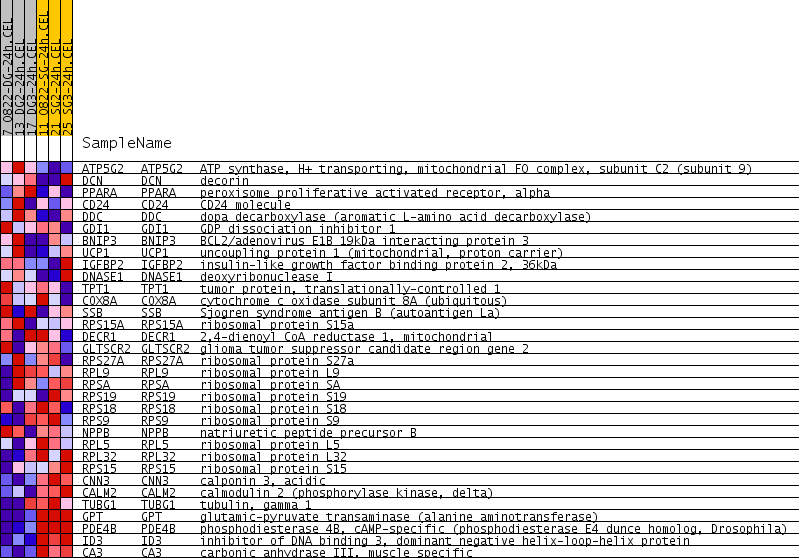
| PROBE | GENE SYMBOL | GENE_TITLE | RANK IN GENE LIST | RANK METRIC SCORE | RUNNING ES | CORE ENRICHMENT | |
|---|---|---|---|---|---|---|---|
| 1 | ATP5G2 | ATP5G2 Entrez, Source | ATP synthase, H+ transporting, mitochondrial F0 complex, subunit C2 (subunit 9) | 87 | 0.184 | 0.0949 | No |
| 2 | DCN | DCN Entrez, Source | decorin | 2379 | 0.054 | -0.0473 | No |
| 3 | PPARA | PPARA Entrez, Source | peroxisome proliferative activated receptor, alpha | 2873 | 0.045 | -0.0595 | No |
| 4 | CD24 | CD24 Entrez, Source | CD24 molecule | 3463 | 0.036 | -0.0841 | No |
| 5 | DDC | DDC Entrez, Source | dopa decarboxylase (aromatic L-amino acid decarboxylase) | 3861 | 0.030 | -0.0972 | No |
| 6 | GDI1 | GDI1 Entrez, Source | GDP dissociation inhibitor 1 | 4303 | 0.025 | -0.1167 | No |
| 7 | BNIP3 | BNIP3 Entrez, Source | BCL2/adenovirus E1B 19kDa interacting protein 3 | 4780 | 0.019 | -0.1421 | No |
| 8 | UCP1 | UCP1 Entrez, Source | uncoupling protein 1 (mitochondrial, proton carrier) | 4988 | 0.016 | -0.1488 | No |
| 9 | IGFBP2 | IGFBP2 Entrez, Source | insulin-like growth factor binding protein 2, 36kDa | 5034 | 0.016 | -0.1435 | No |
| 10 | DNASE1 | DNASE1 Entrez, Source | deoxyribonuclease I | 5235 | 0.013 | -0.1512 | No |
| 11 | TPT1 | TPT1 Entrez, Source | tumor protein, translationally-controlled 1 | 5480 | 0.010 | -0.1638 | No |
| 12 | COX8A | COX8A Entrez, Source | cytochrome c oxidase subunit 8A (ubiquitous) | 5505 | 0.010 | -0.1600 | No |
| 13 | SSB | SSB Entrez, Source | Sjogren syndrome antigen B (autoantigen La) | 5599 | 0.009 | -0.1620 | No |
| 14 | RPS15A | RPS15A Entrez, Source | ribosomal protein S15a | 5897 | 0.006 | -0.1812 | No |
| 15 | DECR1 | DECR1 Entrez, Source | 2,4-dienoyl CoA reductase 1, mitochondrial | 6290 | 0.001 | -0.2099 | No |
| 16 | GLTSCR2 | GLTSCR2 Entrez, Source | glioma tumor suppressor candidate region gene 2 | 6318 | 0.001 | -0.2113 | No |
| 17 | RPS27A | RPS27A Entrez, Source | ribosomal protein S27a | 6407 | 0.000 | -0.2178 | No |
| 18 | RPL9 | RPL9 Entrez, Source | ribosomal protein L9 | 6671 | -0.003 | -0.2361 | No |
| 19 | RPSA | RPSA Entrez, Source | ribosomal protein SA | 6735 | -0.003 | -0.2391 | No |
| 20 | RPS19 | RPS19 Entrez, Source | ribosomal protein S19 | 6802 | -0.004 | -0.2420 | No |
| 21 | RPS18 | RPS18 Entrez, Source | ribosomal protein S18 | 6873 | -0.004 | -0.2448 | No |
| 22 | RPS9 | RPS9 Entrez, Source | ribosomal protein S9 | 7639 | -0.012 | -0.2957 | No |
| 23 | NPPB | NPPB Entrez, Source | natriuretic peptide precursor B | 7667 | -0.012 | -0.2910 | No |
| 24 | RPL5 | RPL5 Entrez, Source | ribosomal protein L5 | 7716 | -0.013 | -0.2876 | No |
| 25 | RPL32 | RPL32 Entrez, Source | ribosomal protein L32 | 7742 | -0.013 | -0.2823 | No |
| 26 | RPS15 | RPS15 Entrez, Source | ribosomal protein S15 | 8752 | -0.023 | -0.3453 | No |
| 27 | CNN3 | CNN3 Entrez, Source | calponin 3, acidic | 9286 | -0.029 | -0.3694 | No |
| 28 | CALM2 | CALM2 Entrez, Source | calmodulin 2 (phosphorylase kinase, delta) | 11629 | -0.063 | -0.5104 | No |
| 29 | TUBG1 | TUBG1 Entrez, Source | tubulin, gamma 1 | 12486 | -0.090 | -0.5248 | Yes |
| 30 | GPT | GPT Entrez, Source | glutamic-pyruvate transaminase (alanine aminotransferase) | 12724 | -0.105 | -0.4848 | Yes |
| 31 | PDE4B | PDE4B Entrez, Source | phosphodiesterase 4B, cAMP-specific (phosphodiesterase E4 dunce homolog, Drosophila) | 13271 | -0.241 | -0.3929 | Yes |
| 32 | ID3 | ID3 Entrez, Source | inhibitor of DNA binding 3, dominant negative helix-loop-helix protein | 13314 | -0.341 | -0.2080 | Yes |
| 33 | CA3 | CA3 Entrez, Source | carbonic anhydrase III, muscle specific | 13324 | -0.380 | 0.0014 | Yes |