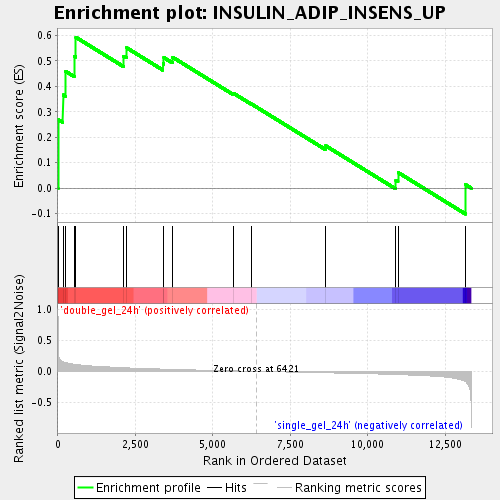
Profile of the Running ES Score & Positions of GeneSet Members on the Rank Ordered List
| Dataset | double_gel_and_single_gel_rma_expression_values_collapsed_to_symbols.class.cls #double_gel_24h_versus_single_gel_24h.class.cls #double_gel_24h_versus_single_gel_24h_repos |
| Phenotype | class.cls#double_gel_24h_versus_single_gel_24h_repos |
| Upregulated in class | double_gel_24h |
| GeneSet | INSULIN_ADIP_INSENS_UP |
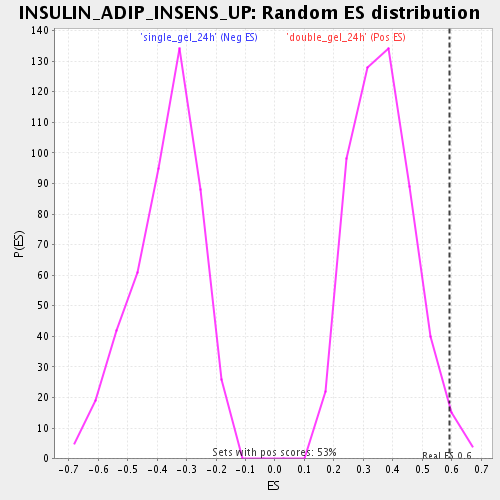
| Enrichment Score (ES) | 0.59289825 |
| Normalized Enrichment Score (NES) | 1.6303374 |
| Nominal p-value | 0.020754717 |
| FDR q-value | 0.1771723 |
| FWER p-Value | 1.0 |
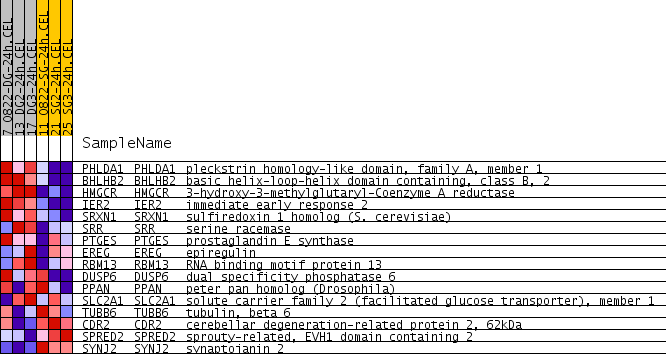
| PROBE | GENE SYMBOL | GENE_TITLE | RANK IN GENE LIST | RANK METRIC SCORE | RUNNING ES | CORE ENRICHMENT | |
|---|---|---|---|---|---|---|---|
| 1 | PHLDA1 | PHLDA1 Entrez, Source | pleckstrin homology-like domain, family A, member 1 | 6 | 0.386 | 0.2696 | Yes |
| 2 | BHLHB2 | BHLHB2 Entrez, Source | basic helix-loop-helix domain containing, class B, 2 | 164 | 0.155 | 0.3665 | Yes |
| 3 | HMGCR | HMGCR Entrez, Source | 3-hydroxy-3-methylglutaryl-Coenzyme A reductase | 250 | 0.141 | 0.4590 | Yes |
| 4 | IER2 | IER2 Entrez, Source | immediate early response 2 | 528 | 0.115 | 0.5186 | Yes |
| 5 | SRXN1 | SRXN1 Entrez, Source | sulfiredoxin 1 homolog (S. cerevisiae) | 579 | 0.111 | 0.5929 | Yes |
| 6 | SRR | SRR Entrez, Source | serine racemase | 2120 | 0.060 | 0.5190 | No |
| 7 | PTGES | PTGES Entrez, Source | prostaglandin E synthase | 2220 | 0.057 | 0.5514 | No |
| 8 | EREG | EREG Entrez, Source | epiregulin | 3391 | 0.037 | 0.4894 | No |
| 9 | RBM13 | RBM13 Entrez, Source | RNA binding motif protein 13 | 3419 | 0.036 | 0.5128 | No |
| 10 | DUSP6 | DUSP6 Entrez, Source | dual specificity phosphatase 6 | 3699 | 0.033 | 0.5146 | No |
| 11 | PPAN | PPAN Entrez, Source | peter pan homolog (Drosophila) | 5662 | 0.008 | 0.3732 | No |
| 12 | SLC2A1 | SLC2A1 Entrez, Source | solute carrier family 2 (facilitated glucose transporter), member 1 | 6242 | 0.002 | 0.3311 | No |
| 13 | TUBB6 | TUBB6 Entrez, Source | tubulin, beta 6 | 8646 | -0.022 | 0.1664 | No |
| 14 | CDR2 | CDR2 Entrez, Source | cerebellar degeneration-related protein 2, 62kDa | 10906 | -0.050 | 0.0317 | No |
| 15 | SPRED2 | SPRED2 Entrez, Source | sprouty-related, EVH1 domain containing 2 | 10977 | -0.051 | 0.0619 | No |
| 16 | SYNJ2 | SYNJ2 Entrez, Source | synaptojanin 2 | 13158 | -0.165 | 0.0138 | No |