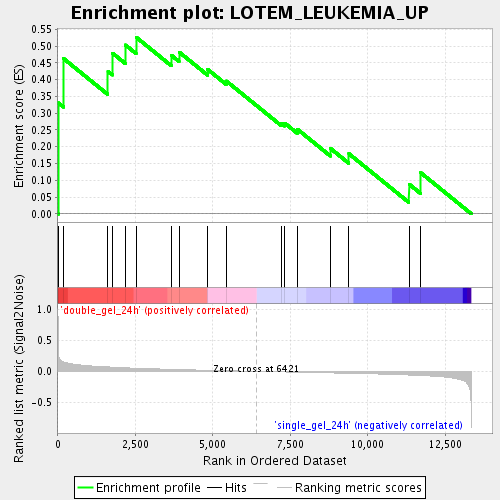
Profile of the Running ES Score & Positions of GeneSet Members on the Rank Ordered List
| Dataset | double_gel_and_single_gel_rma_expression_values_collapsed_to_symbols.class.cls #double_gel_24h_versus_single_gel_24h.class.cls #double_gel_24h_versus_single_gel_24h_repos |
| Phenotype | class.cls#double_gel_24h_versus_single_gel_24h_repos |
| Upregulated in class | double_gel_24h |
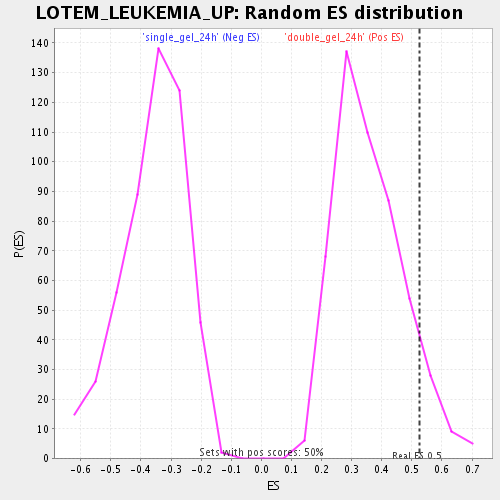
| GeneSet | LOTEM_LEUKEMIA_UP |
| Enrichment Score (ES) | 0.5264292 |
| Normalized Enrichment Score (NES) | 1.4643111 |
| Nominal p-value | 0.083333336 |
| FDR q-value | 0.29179633 |
| FWER p-Value | 1.0 |
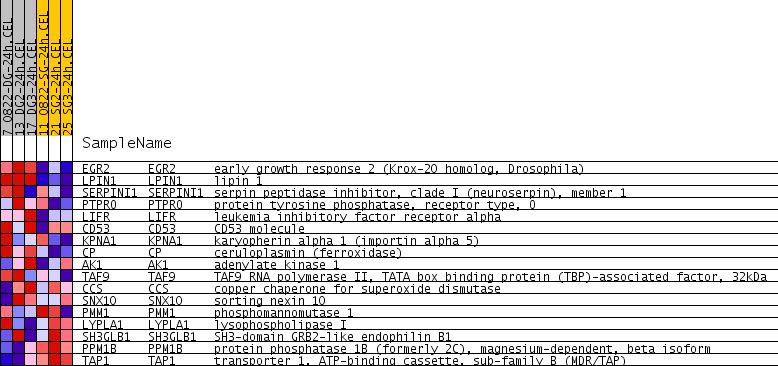
| PROBE | GENE SYMBOL | GENE_TITLE | RANK IN GENE LIST | RANK METRIC SCORE | RUNNING ES | CORE ENRICHMENT | |
|---|---|---|---|---|---|---|---|
| 1 | EGR2 | EGR2 Entrez, Source | early growth response 2 (Krox-20 homolog, Drosophila) | 10 | 0.347 | 0.3309 | Yes |
| 2 | LPIN1 | LPIN1 Entrez, Source | lipin 1 | 182 | 0.151 | 0.4629 | Yes |
| 3 | SERPINI1 | SERPINI1 Entrez, Source | serpin peptidase inhibitor, clade I (neuroserpin), member 1 | 1615 | 0.072 | 0.4244 | Yes |
| 4 | PTPRO | PTPRO Entrez, Source | protein tyrosine phosphatase, receptor type, O | 1758 | 0.068 | 0.4793 | Yes |
| 5 | LIFR | LIFR Entrez, Source | leukemia inhibitory factor receptor alpha | 2179 | 0.058 | 0.5034 | Yes |
| 6 | CD53 | CD53 Entrez, Source | CD53 molecule | 2526 | 0.051 | 0.5264 | Yes |
| 7 | KPNA1 | KPNA1 Entrez, Source | karyopherin alpha 1 (importin alpha 5) | 3668 | 0.033 | 0.4722 | No |
| 8 | CP | CP Entrez, Source | ceruloplasmin (ferroxidase) | 3912 | 0.030 | 0.4822 | No |
| 9 | AK1 | AK1 Entrez, Source | adenylate kinase 1 | 4832 | 0.018 | 0.4306 | No |
| 10 | TAF9 | TAF9 Entrez, Source | TAF9 RNA polymerase II, TATA box binding protein (TBP)-associated factor, 32kDa | 5433 | 0.011 | 0.3961 | No |
| 11 | CCS | CCS Entrez, Source | copper chaperone for superoxide dismutase | 7212 | -0.008 | 0.2701 | No |
| 12 | SNX10 | SNX10 Entrez, Source | sorting nexin 10 | 7325 | -0.009 | 0.2702 | No |
| 13 | PMM1 | PMM1 Entrez, Source | phosphomannomutase 1 | 7723 | -0.013 | 0.2526 | No |
| 14 | LYPLA1 | LYPLA1 Entrez, Source | lysophospholipase I | 8796 | -0.024 | 0.1950 | No |
| 15 | SH3GLB1 | SH3GLB1 Entrez, Source | SH3-domain GRB2-like endophilin B1 | 9390 | -0.030 | 0.1792 | No |
| 16 | PPM1B | PPM1B Entrez, Source | protein phosphatase 1B (formerly 2C), magnesium-dependent, beta isoform | 11331 | -0.058 | 0.0887 | No |
| 17 | TAP1 | TAP1 Entrez, Source | transporter 1, ATP-binding cassette, sub-family B (MDR/TAP) | 11710 | -0.065 | 0.1225 | No |