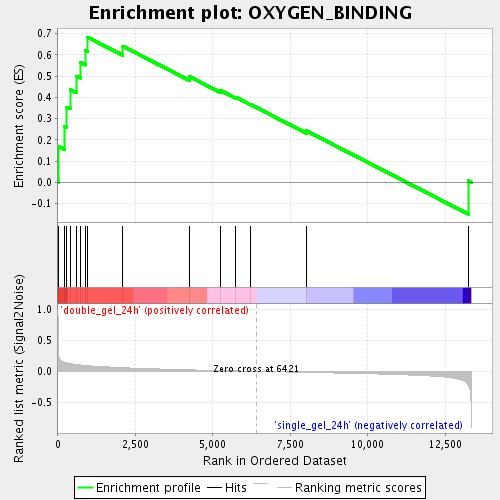
Profile of the Running ES Score & Positions of GeneSet Members on the Rank Ordered List
| Dataset | double_gel_and_single_gel_rma_expression_values_collapsed_to_symbols.class.cls #double_gel_24h_versus_single_gel_24h.class.cls #double_gel_24h_versus_single_gel_24h_repos |
| Phenotype | class.cls#double_gel_24h_versus_single_gel_24h_repos |
| Upregulated in class | double_gel_24h |
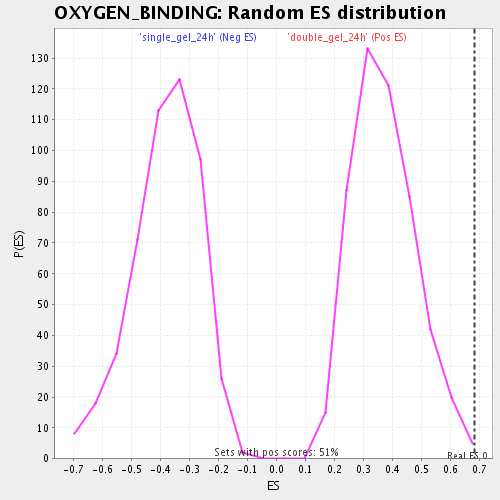
| GeneSet | OXYGEN_BINDING |
| Enrichment Score (ES) | 0.68310535 |
| Normalized Enrichment Score (NES) | 1.8407407 |
| Nominal p-value | 0.001968504 |
| FDR q-value | 0.074740425 |
| FWER p-Value | 0.929 |
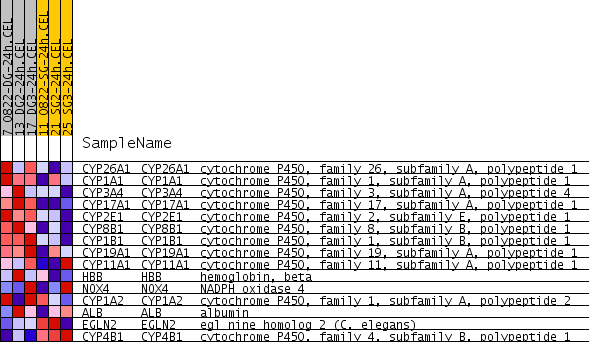
| PROBE | GENE SYMBOL | GENE_TITLE | RANK IN GENE LIST | RANK METRIC SCORE | RUNNING ES | CORE ENRICHMENT | |
|---|---|---|---|---|---|---|---|
| 1 | CYP26A1 | CYP26A1 Entrez, Source | cytochrome P450, family 26, subfamily A, polypeptide 1 | 27 | 0.239 | 0.1697 | Yes |
| 2 | CYP1A1 | CYP1A1 Entrez, Source | cytochrome P450, family 1, subfamily A, polypeptide 1 | 204 | 0.149 | 0.2630 | Yes |
| 3 | CYP3A4 | CYP3A4 Entrez, Source | cytochrome P450, family 3, subfamily A, polypeptide 4 | 290 | 0.137 | 0.3546 | Yes |
| 4 | CYP17A1 | CYP17A1 Entrez, Source | cytochrome P450, family 17, subfamily A, polypeptide 1 | 397 | 0.126 | 0.4367 | Yes |
| 5 | CYP2E1 | CYP2E1 Entrez, Source | cytochrome P450, family 2, subfamily E, polypeptide 1 | 601 | 0.110 | 0.5004 | Yes |
| 6 | CYP8B1 | CYP8B1 Entrez, Source | cytochrome P450, family 8, subfamily B, polypeptide 1 | 725 | 0.103 | 0.5652 | Yes |
| 7 | CYP1B1 | CYP1B1 Entrez, Source | cytochrome P450, family 1, subfamily B, polypeptide 1 | 895 | 0.096 | 0.6211 | Yes |
| 8 | CYP19A1 | CYP19A1 Entrez, Source | cytochrome P450, family 19, subfamily A, polypeptide 1 | 960 | 0.093 | 0.6831 | Yes |
| 9 | CYP11A1 | CYP11A1 Entrez, Source | cytochrome P450, family 11, subfamily A, polypeptide 1 | 2097 | 0.060 | 0.6410 | No |
| 10 | HBB | HBB Entrez, Source | hemoglobin, beta | 4244 | 0.025 | 0.4981 | No |
| 11 | NOX4 | NOX4 Entrez, Source | NADPH oxidase 4 | 5251 | 0.013 | 0.4321 | No |
| 12 | CYP1A2 | CYP1A2 Entrez, Source | cytochrome P450, family 1, subfamily A, polypeptide 2 | 5738 | 0.007 | 0.4010 | No |
| 13 | ALB | ALB Entrez, Source | albumin | 6213 | 0.002 | 0.3670 | No |
| 14 | EGLN2 | EGLN2 Entrez, Source | egl nine homolog 2 (C. elegans) | 8020 | -0.016 | 0.2429 | No |
| 15 | CYP4B1 | CYP4B1 Entrez, Source | cytochrome P450, family 4, subfamily B, polypeptide 1 | 13244 | -0.218 | 0.0074 | No |