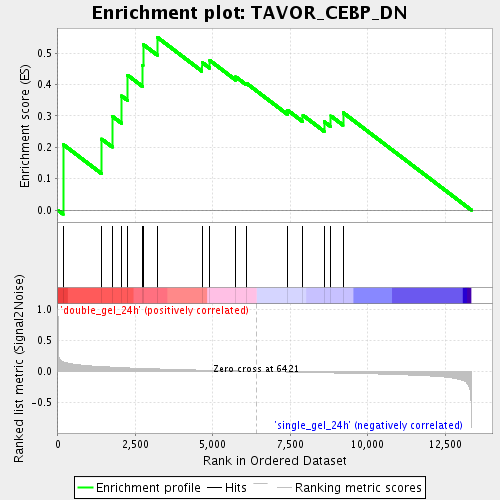
Profile of the Running ES Score & Positions of GeneSet Members on the Rank Ordered List
| Dataset | double_gel_and_single_gel_rma_expression_values_collapsed_to_symbols.class.cls #double_gel_24h_versus_single_gel_24h.class.cls #double_gel_24h_versus_single_gel_24h_repos |
| Phenotype | class.cls#double_gel_24h_versus_single_gel_24h_repos |
| Upregulated in class | double_gel_24h |
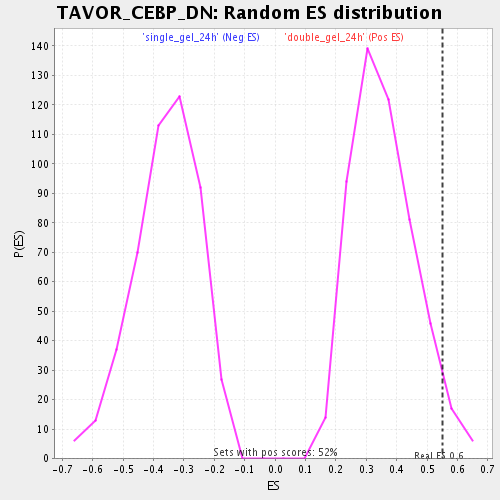
| GeneSet | TAVOR_CEBP_DN |
| Enrichment Score (ES) | 0.5503424 |
| Normalized Enrichment Score (NES) | 1.5408003 |
| Nominal p-value | 0.040462427 |
| FDR q-value | 0.23849705 |
| FWER p-Value | 1.0 |
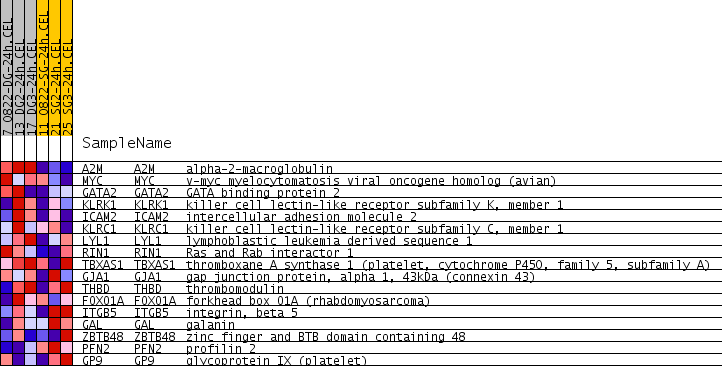
| PROBE | GENE SYMBOL | GENE_TITLE | RANK IN GENE LIST | RANK METRIC SCORE | RUNNING ES | CORE ENRICHMENT | |
|---|---|---|---|---|---|---|---|
| 1 | A2M | A2M Entrez, Source | alpha-2-macroglobulin | 167 | 0.155 | 0.2093 | Yes |
| 2 | MYC | MYC Entrez, Source | v-myc myelocytomatosis viral oncogene homolog (avian) | 1411 | 0.077 | 0.2266 | Yes |
| 3 | GATA2 | GATA2 Entrez, Source | GATA binding protein 2 | 1755 | 0.069 | 0.2988 | Yes |
| 4 | KLRK1 | KLRK1 Entrez, Source | killer cell lectin-like receptor subfamily K, member 1 | 2055 | 0.061 | 0.3636 | Yes |
| 5 | ICAM2 | ICAM2 Entrez, Source | intercellular adhesion molecule 2 | 2246 | 0.056 | 0.4300 | Yes |
| 6 | KLRC1 | KLRC1 Entrez, Source | killer cell lectin-like receptor subfamily C, member 1 | 2733 | 0.047 | 0.4613 | Yes |
| 7 | LYL1 | LYL1 Entrez, Source | lymphoblastic leukemia derived sequence 1 | 2748 | 0.047 | 0.5277 | Yes |
| 8 | RIN1 | RIN1 Entrez, Source | Ras and Rab interactor 1 | 3207 | 0.040 | 0.5503 | Yes |
| 9 | TBXAS1 | TBXAS1 Entrez, Source | thromboxane A synthase 1 (platelet, cytochrome P450, family 5, subfamily A) | 4650 | 0.020 | 0.4708 | No |
| 10 | GJA1 | GJA1 Entrez, Source | gap junction protein, alpha 1, 43kDa (connexin 43) | 4902 | 0.017 | 0.4766 | No |
| 11 | THBD | THBD Entrez, Source | thrombomodulin | 5742 | 0.007 | 0.4242 | No |
| 12 | FOXO1A | FOXO1A Entrez, Source | forkhead box O1A (rhabdomyosarcoma) | 6085 | 0.004 | 0.4040 | No |
| 13 | ITGB5 | ITGB5 Entrez, Source | integrin, beta 5 | 7411 | -0.010 | 0.3183 | No |
| 14 | GAL | GAL Entrez, Source | galanin | 7908 | -0.015 | 0.3020 | No |
| 15 | ZBTB48 | ZBTB48 Entrez, Source | zinc finger and BTB domain containing 48 | 8594 | -0.022 | 0.2817 | No |
| 16 | PFN2 | PFN2 Entrez, Source | profilin 2 | 8811 | -0.024 | 0.2998 | No |
| 17 | GP9 | GP9 Entrez, Source | glycoprotein IX (platelet) | 9202 | -0.028 | 0.3107 | No |