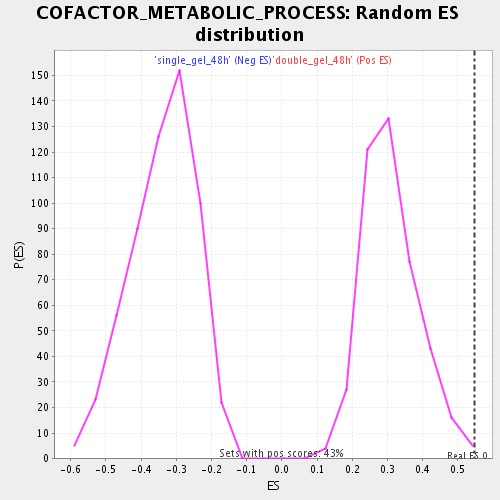
Profile of the Running ES Score & Positions of GeneSet Members on the Rank Ordered List
| Dataset | double_gel_and_single_gel_rma_expression_values_collapsed_to_symbols.class.cls #double_gel_48h_versus_single_gel_48h.class.cls #double_gel_48h_versus_single_gel_48h_repos |
| Phenotype | class.cls#double_gel_48h_versus_single_gel_48h_repos |
| Upregulated in class | double_gel_48h |
| GeneSet | COFACTOR_METABOLIC_PROCESS |
| Enrichment Score (ES) | 0.5477676 |
| Normalized Enrichment Score (NES) | 1.7883818 |
| Nominal p-value | 0.0023474179 |
| FDR q-value | 0.035307992 |
| FWER p-Value | 0.933 |
| PROBE | GENE SYMBOL | GENE_TITLE | RANK IN GENE LIST | RANK METRIC SCORE | RUNNING ES | CORE ENRICHMENT | |
|---|---|---|---|---|---|---|---|
| 1 | FTCD | FTCD Entrez, Source | formiminotransferase cyclodeaminase | 27 | 0.336 | 0.1515 | Yes |
| 2 | GLYAT | GLYAT Entrez, Source | glycine-N-acyltransferase | 102 | 0.225 | 0.2486 | Yes |
| 3 | ACLY | ACLY Entrez, Source | ATP citrate lyase | 127 | 0.202 | 0.3394 | Yes |
| 4 | ALAS1 | ALAS1 Entrez, Source | aminolevulinate, delta-, synthase 1 | 300 | 0.149 | 0.3948 | Yes |
| 5 | ALDH1L1 | ALDH1L1 Entrez, Source | aldehyde dehydrogenase 1 family, member L1 | 502 | 0.125 | 0.4368 | Yes |
| 6 | PDHB | PDHB Entrez, Source | pyruvate dehydrogenase (lipoamide) beta | 1159 | 0.091 | 0.4290 | Yes |
| 7 | GCLC | GCLC Entrez, Source | glutamate-cysteine ligase, catalytic subunit | 1237 | 0.088 | 0.4636 | Yes |
| 8 | MOCS2 | MOCS2 Entrez, Source | molybdenum cofactor synthesis 2 | 1490 | 0.080 | 0.4811 | Yes |
| 9 | ME1 | ME1 Entrez, Source | malic enzyme 1, NADP(+)-dependent, cytosolic | 1493 | 0.080 | 0.5173 | Yes |
| 10 | COQ7 | COQ7 Entrez, Source | coenzyme Q7 homolog, ubiquinone (yeast) | 1563 | 0.078 | 0.5478 | Yes |
| 11 | MLYCD | MLYCD Entrez, Source | malonyl-CoA decarboxylase | 2302 | 0.062 | 0.5206 | No |
| 12 | ALAD | ALAD Entrez, Source | aminolevulinate, delta-, dehydratase | 2787 | 0.054 | 0.5088 | No |
| 13 | ACOT2 | ACOT2 Entrez, Source | acyl-CoA thioesterase 2 | 3435 | 0.044 | 0.4802 | No |
| 14 | COASY | COASY Entrez, Source | Coenzyme A synthase | 3750 | 0.040 | 0.4749 | No |
| 15 | ACO2 | ACO2 Entrez, Source | aconitase 2, mitochondrial | 3799 | 0.039 | 0.4893 | No |
| 16 | SDHA | SDHA Entrez, Source | succinate dehydrogenase complex, subunit A, flavoprotein (Fp) | 4559 | 0.029 | 0.4456 | No |
| 17 | SDHD | SDHD Entrez, Source | succinate dehydrogenase complex, subunit D, integral membrane protein | 5418 | 0.019 | 0.3899 | No |
| 18 | SDHC | SDHC Entrez, Source | succinate dehydrogenase complex, subunit C, integral membrane protein, 15kDa | 5522 | 0.018 | 0.3904 | No |
| 19 | NFS1 | NFS1 Entrez, Source | NFS1 nitrogen fixation 1 (S. cerevisiae) | 5674 | 0.016 | 0.3865 | No |
| 20 | GCLM | GCLM Entrez, Source | glutamate-cysteine ligase, modifier subunit | 6039 | 0.012 | 0.3648 | No |
| 21 | GLRX2 | GLRX2 Entrez, Source | glutaredoxin 2 | 6489 | 0.008 | 0.3346 | No |
| 22 | COQ3 | COQ3 Entrez, Source | coenzyme Q3 homolog, methyltransferase (S. cerevisiae) | 7225 | -0.001 | 0.2796 | No |
| 23 | UROS | UROS Entrez, Source | uroporphyrinogen III synthase (congenital erythropoietic porphyria) | 7495 | -0.004 | 0.2611 | No |
| 24 | BLVRA | BLVRA Entrez, Source | biliverdin reductase A | 7498 | -0.004 | 0.2627 | No |
| 25 | ACOT12 | ACOT12 Entrez, Source | acyl-CoA thioesterase 12 | 7714 | -0.006 | 0.2493 | No |
| 26 | CPOX | CPOX Entrez, Source | coproporphyrinogen oxidase | 7776 | -0.007 | 0.2478 | No |
| 27 | ALAS2 | ALAS2 Entrez, Source | aminolevulinate, delta-, synthase 2 (sideroblastic/hypochromic anemia) | 8816 | -0.019 | 0.1786 | No |
| 28 | SOD1 | SOD1 Entrez, Source | superoxide dismutase 1, soluble (amyotrophic lateral sclerosis 1 (adult)) | 9099 | -0.023 | 0.1680 | No |
| 29 | GPX1 | GPX1 Entrez, Source | glutathione peroxidase 1 | 10706 | -0.050 | 0.0700 | No |
| 30 | COX15 | COX15 Entrez, Source | COX15 homolog, cytochrome c oxidase assembly protein (yeast) | 10952 | -0.055 | 0.0766 | No |
| 31 | TSPO | TSPO Entrez, Source | translocator protein (18kDa) | 12217 | -0.098 | 0.0264 | No |
| 32 | PPT1 | PPT1 Entrez, Source | palmitoyl-protein thioesterase 1 (ceroid-lipofuscinosis, neuronal 1, infantile) | 12619 | -0.127 | 0.0543 | No |