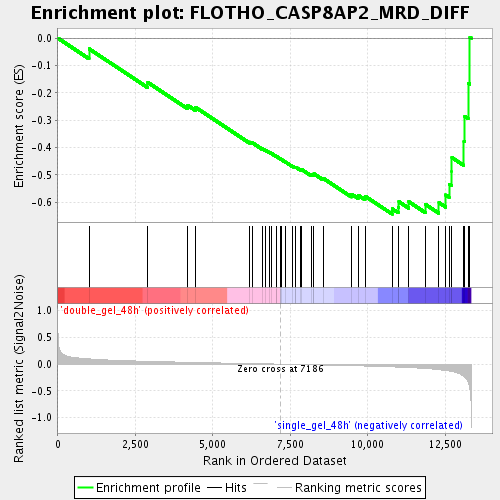
Profile of the Running ES Score & Positions of GeneSet Members on the Rank Ordered List
| Dataset | double_gel_and_single_gel_rma_expression_values_collapsed_to_symbols.class.cls #double_gel_48h_versus_single_gel_48h.class.cls #double_gel_48h_versus_single_gel_48h_repos |
| Phenotype | class.cls#double_gel_48h_versus_single_gel_48h_repos |
| Upregulated in class | single_gel_48h |
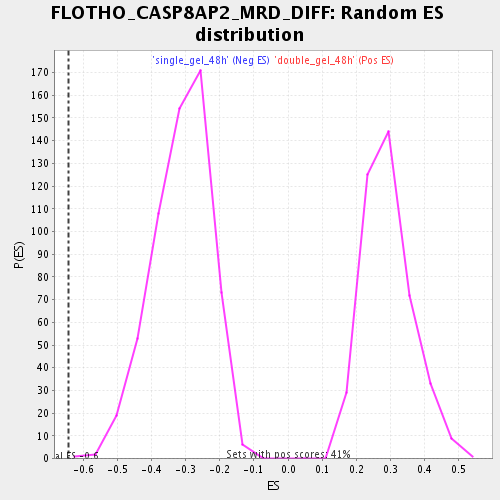
| GeneSet | FLOTHO_CASP8AP2_MRD_DIFF |
| Enrichment Score (ES) | -0.64388686 |
| Normalized Enrichment Score (NES) | -2.0566154 |
| Nominal p-value | 0.0017035775 |
| FDR q-value | 0.004763656 |
| FWER p-Value | 0.089 |
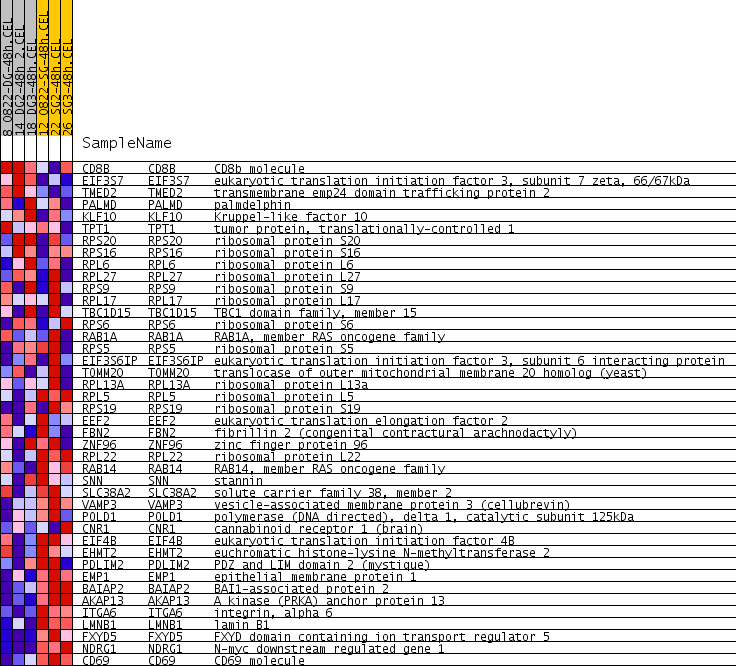
| PROBE | GENE SYMBOL | GENE_TITLE | RANK IN GENE LIST | RANK METRIC SCORE | RUNNING ES | CORE ENRICHMENT | |
|---|---|---|---|---|---|---|---|
| 1 | CD8B | CD8B Entrez, Source | CD8b molecule | 1005 | 0.097 | -0.0389 | No |
| 2 | EIF3S7 | EIF3S7 Entrez, Source | eukaryotic translation initiation factor 3, subunit 7 zeta, 66/67kDa | 2900 | 0.052 | -0.1618 | No |
| 3 | TMED2 | TMED2 Entrez, Source | transmembrane emp24 domain trafficking protein 2 | 4183 | 0.034 | -0.2453 | No |
| 4 | PALMD | PALMD Entrez, Source | palmdelphin | 4443 | 0.031 | -0.2532 | No |
| 5 | KLF10 | KLF10 Entrez, Source | Kruppel-like factor 10 | 6186 | 0.011 | -0.3800 | No |
| 6 | TPT1 | TPT1 Entrez, Source | tumor protein, translationally-controlled 1 | 6276 | 0.010 | -0.3829 | No |
| 7 | RPS20 | RPS20 Entrez, Source | ribosomal protein S20 | 6598 | 0.006 | -0.4046 | No |
| 8 | RPS16 | RPS16 Entrez, Source | ribosomal protein S16 | 6707 | 0.005 | -0.4107 | No |
| 9 | RPL6 | RPL6 Entrez, Source | ribosomal protein L6 | 6827 | 0.004 | -0.4182 | No |
| 10 | RPL27 | RPL27 Entrez, Source | ribosomal protein L27 | 6900 | 0.003 | -0.4225 | No |
| 11 | RPS9 | RPS9 Entrez, Source | ribosomal protein S9 | 7043 | 0.002 | -0.4326 | No |
| 12 | RPL17 | RPL17 Entrez, Source | ribosomal protein L17 | 7045 | 0.002 | -0.4321 | No |
| 13 | TBC1D15 | TBC1D15 Entrez, Source | TBC1 domain family, member 15 | 7169 | 0.000 | -0.4413 | No |
| 14 | RPS6 | RPS6 Entrez, Source | ribosomal protein S6 | 7180 | 0.000 | -0.4420 | No |
| 15 | RAB1A | RAB1A Entrez, Source | RAB1A, member RAS oncogene family | 7222 | -0.000 | -0.4449 | No |
| 16 | RPS5 | RPS5 Entrez, Source | ribosomal protein S5 | 7352 | -0.002 | -0.4539 | No |
| 17 | EIF3S6IP | EIF3S6IP Entrez, Source | eukaryotic translation initiation factor 3, subunit 6 interacting protein | 7580 | -0.005 | -0.4692 | No |
| 18 | TOMM20 | TOMM20 Entrez, Source | translocase of outer mitochondrial membrane 20 homolog (yeast) | 7655 | -0.005 | -0.4727 | No |
| 19 | RPL13A | RPL13A Entrez, Source | ribosomal protein L13a | 7679 | -0.006 | -0.4724 | No |
| 20 | RPL5 | RPL5 Entrez, Source | ribosomal protein L5 | 7825 | -0.007 | -0.4805 | No |
| 21 | RPS19 | RPS19 Entrez, Source | ribosomal protein S19 | 7848 | -0.008 | -0.4792 | No |
| 22 | EEF2 | EEF2 Entrez, Source | eukaryotic translation elongation factor 2 | 8180 | -0.012 | -0.4997 | No |
| 23 | FBN2 | FBN2 Entrez, Source | fibrillin 2 (congenital contractural arachnodactyly) | 8235 | -0.012 | -0.4992 | No |
| 24 | ZNF96 | ZNF96 Entrez, Source | zinc finger protein 96 | 8264 | -0.013 | -0.4966 | No |
| 25 | RPL22 | RPL22 Entrez, Source | ribosomal protein L22 | 8557 | -0.016 | -0.5124 | No |
| 26 | RAB14 | RAB14 Entrez, Source | RAB14, member RAS oncogene family | 9475 | -0.029 | -0.5706 | No |
| 27 | SNN | SNN Entrez, Source | stannin | 9690 | -0.032 | -0.5747 | No |
| 28 | SLC38A2 | SLC38A2 Entrez, Source | solute carrier family 38, member 2 | 9913 | -0.035 | -0.5782 | No |
| 29 | VAMP3 | VAMP3 Entrez, Source | vesicle-associated membrane protein 3 (cellubrevin) | 10788 | -0.051 | -0.6245 | Yes |
| 30 | POLD1 | POLD1 Entrez, Source | polymerase (DNA directed), delta 1, catalytic subunit 125kDa | 10985 | -0.056 | -0.6183 | Yes |
| 31 | CNR1 | CNR1 Entrez, Source | cannabinoid receptor 1 (brain) | 11005 | -0.056 | -0.5986 | Yes |
| 32 | EIF4B | EIF4B Entrez, Source | eukaryotic translation initiation factor 4B | 11325 | -0.063 | -0.5988 | Yes |
| 33 | EHMT2 | EHMT2 Entrez, Source | euchromatic histone-lysine N-methyltransferase 2 | 11859 | -0.081 | -0.6081 | Yes |
| 34 | PDLIM2 | PDLIM2 Entrez, Source | PDZ and LIM domain 2 (mystique) | 12297 | -0.103 | -0.6021 | Yes |
| 35 | EMP1 | EMP1 Entrez, Source | epithelial membrane protein 1 | 12519 | -0.119 | -0.5738 | Yes |
| 36 | BAIAP2 | BAIAP2 Entrez, Source | BAI1-associated protein 2 | 12628 | -0.128 | -0.5337 | Yes |
| 37 | AKAP13 | AKAP13 Entrez, Source | A kinase (PRKA) anchor protein 13 | 12712 | -0.136 | -0.4886 | Yes |
| 38 | ITGA6 | ITGA6 Entrez, Source | integrin, alpha 6 | 12716 | -0.137 | -0.4372 | Yes |
| 39 | LMNB1 | LMNB1 Entrez, Source | lamin B1 | 13104 | -0.234 | -0.3780 | Yes |
| 40 | FXYD5 | FXYD5 Entrez, Source | FXYD domain containing ion transport regulator 5 | 13131 | -0.248 | -0.2866 | Yes |
| 41 | NDRG1 | NDRG1 Entrez, Source | N-myc downstream regulated gene 1 | 13242 | -0.345 | -0.1648 | Yes |
| 42 | CD69 | CD69 Entrez, Source | CD69 molecule | 13297 | -0.457 | 0.0034 | Yes |