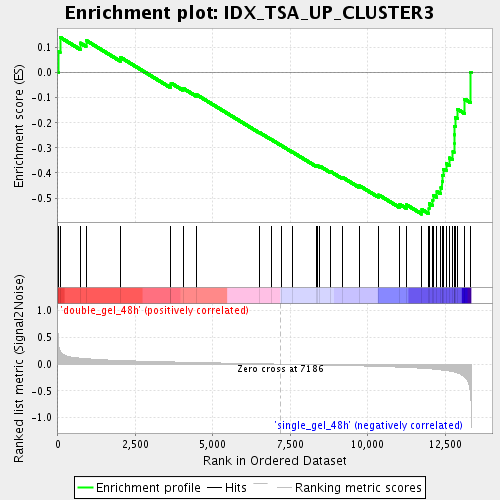
Profile of the Running ES Score & Positions of GeneSet Members on the Rank Ordered List
| Dataset | double_gel_and_single_gel_rma_expression_values_collapsed_to_symbols.class.cls #double_gel_48h_versus_single_gel_48h.class.cls #double_gel_48h_versus_single_gel_48h_repos |
| Phenotype | class.cls#double_gel_48h_versus_single_gel_48h_repos |
| Upregulated in class | single_gel_48h |
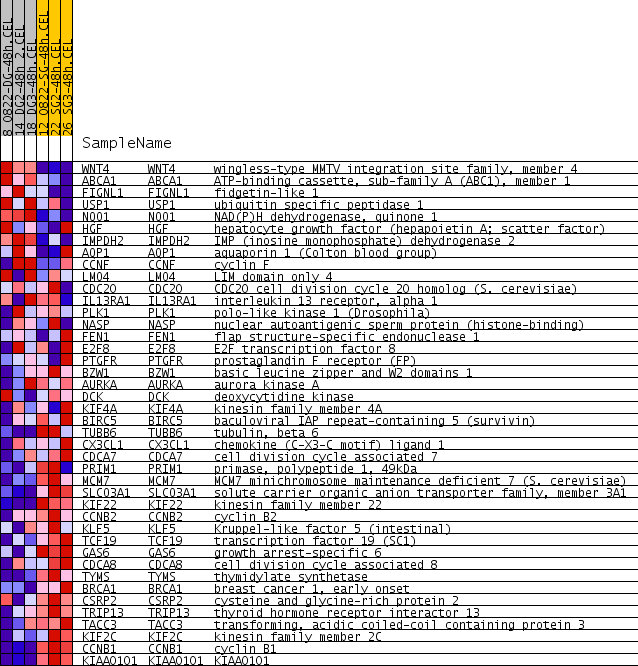
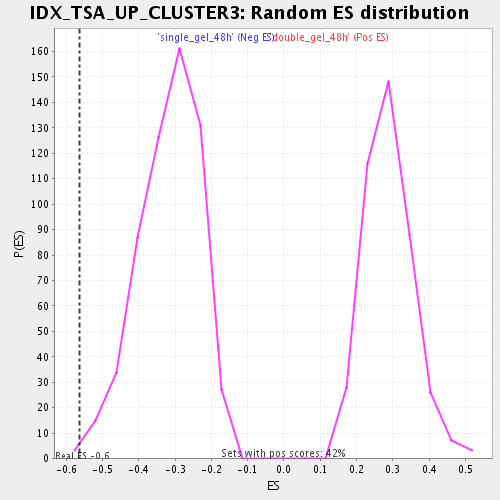
| GeneSet | IDX_TSA_UP_CLUSTER3 |
| Enrichment Score (ES) | -0.5638635 |
| Normalized Enrichment Score (NES) | -1.7829694 |
| Nominal p-value | 0.0017123288 |
| FDR q-value | 0.04508872 |
| FWER p-Value | 0.986 |
| PROBE | GENE SYMBOL | GENE_TITLE | RANK IN GENE LIST | RANK METRIC SCORE | RUNNING ES | CORE ENRICHMENT | |
|---|---|---|---|---|---|---|---|
| 1 | WNT4 | WNT4 Entrez, Source | wingless-type MMTV integration site family, member 4 | 16 | 0.365 | 0.0854 | No |
| 2 | ABCA1 | ABCA1 Entrez, Source | ATP-binding cassette, sub-family A (ABC1), member 1 | 71 | 0.251 | 0.1409 | No |
| 3 | FIGNL1 | FIGNL1 Entrez, Source | fidgetin-like 1 | 723 | 0.110 | 0.1181 | No |
| 4 | USP1 | USP1 Entrez, Source | ubiquitin specific peptidase 1 | 909 | 0.102 | 0.1284 | No |
| 5 | NQO1 | NQO1 Entrez, Source | NAD(P)H dehydrogenase, quinone 1 | 2016 | 0.068 | 0.0613 | No |
| 6 | HGF | HGF Entrez, Source | hepatocyte growth factor (hepapoietin A; scatter factor) | 3627 | 0.041 | -0.0499 | No |
| 7 | IMPDH2 | IMPDH2 Entrez, Source | IMP (inosine monophosphate) dehydrogenase 2 | 3648 | 0.041 | -0.0416 | No |
| 8 | AQP1 | AQP1 Entrez, Source | aquaporin 1 (Colton blood group) | 4037 | 0.036 | -0.0623 | No |
| 9 | CCNF | CCNF Entrez, Source | cyclin F | 4467 | 0.030 | -0.0874 | No |
| 10 | LMO4 | LMO4 Entrez, Source | LIM domain only 4 | 6509 | 0.007 | -0.2391 | No |
| 11 | CDC20 | CDC20 Entrez, Source | CDC20 cell division cycle 20 homolog (S. cerevisiae) | 6894 | 0.003 | -0.2672 | No |
| 12 | IL13RA1 | IL13RA1 Entrez, Source | interleukin 13 receptor, alpha 1 | 7219 | -0.000 | -0.2914 | No |
| 13 | PLK1 | PLK1 Entrez, Source | polo-like kinase 1 (Drosophila) | 7563 | -0.004 | -0.3162 | No |
| 14 | NASP | NASP Entrez, Source | nuclear autoantigenic sperm protein (histone-binding) | 8337 | -0.013 | -0.3711 | No |
| 15 | FEN1 | FEN1 Entrez, Source | flap structure-specific endonuclease 1 | 8375 | -0.014 | -0.3706 | No |
| 16 | E2F8 | E2F8 Entrez, Source | E2F transcription factor 8 | 8457 | -0.015 | -0.3731 | No |
| 17 | PTGFR | PTGFR Entrez, Source | prostaglandin F receptor (FP) | 8805 | -0.019 | -0.3946 | No |
| 18 | BZW1 | BZW1 Entrez, Source | basic leucine zipper and W2 domains 1 | 9170 | -0.024 | -0.4163 | No |
| 19 | AURKA | AURKA Entrez, Source | aurora kinase A | 9722 | -0.032 | -0.4500 | No |
| 20 | DCK | DCK Entrez, Source | deoxycytidine kinase | 10358 | -0.043 | -0.4877 | No |
| 21 | KIF4A | KIF4A Entrez, Source | kinesin family member 4A | 11030 | -0.056 | -0.5247 | No |
| 22 | BIRC5 | BIRC5 Entrez, Source | baculoviral IAP repeat-containing 5 (survivin) | 11253 | -0.061 | -0.5269 | No |
| 23 | TUBB6 | TUBB6 Entrez, Source | tubulin, beta 6 | 11746 | -0.077 | -0.5456 | Yes |
| 24 | CX3CL1 | CX3CL1 Entrez, Source | chemokine (C-X3-C motif) ligand 1 | 11975 | -0.086 | -0.5424 | Yes |
| 25 | CDCA7 | CDCA7 Entrez, Source | cell division cycle associated 7 | 11981 | -0.086 | -0.5223 | Yes |
| 26 | PRIM1 | PRIM1 Entrez, Source | primase, polypeptide 1, 49kDa | 12091 | -0.091 | -0.5089 | Yes |
| 27 | MCM7 | MCM7 Entrez, Source | MCM7 minichromosome maintenance deficient 7 (S. cerevisiae) | 12106 | -0.092 | -0.4882 | Yes |
| 28 | SLCO3A1 | SLCO3A1 Entrez, Source | solute carrier organic anion transporter family, member 3A1 | 12233 | -0.099 | -0.4742 | Yes |
| 29 | KIF22 | KIF22 Entrez, Source | kinesin family member 22 | 12361 | -0.108 | -0.4582 | Yes |
| 30 | CCNB2 | CCNB2 Entrez, Source | cyclin B2 | 12396 | -0.111 | -0.4345 | Yes |
| 31 | KLF5 | KLF5 Entrez, Source | Kruppel-like factor 5 (intestinal) | 12409 | -0.112 | -0.4089 | Yes |
| 32 | TCF19 | TCF19 Entrez, Source | transcription factor 19 (SC1) | 12445 | -0.114 | -0.3846 | Yes |
| 33 | GAS6 | GAS6 Entrez, Source | growth arrest-specific 6 | 12538 | -0.120 | -0.3629 | Yes |
| 34 | CDCA8 | CDCA8 Entrez, Source | cell division cycle associated 8 | 12643 | -0.129 | -0.3401 | Yes |
| 35 | TYMS | TYMS Entrez, Source | thymidylate synthetase | 12749 | -0.141 | -0.3146 | Yes |
| 36 | BRCA1 | BRCA1 Entrez, Source | breast cancer 1, early onset | 12787 | -0.146 | -0.2828 | Yes |
| 37 | CSRP2 | CSRP2 Entrez, Source | cysteine and glycine-rich protein 2 | 12792 | -0.147 | -0.2483 | Yes |
| 38 | TRIP13 | TRIP13 Entrez, Source | thyroid hormone receptor interactor 13 | 12798 | -0.147 | -0.2138 | Yes |
| 39 | TACC3 | TACC3 Entrez, Source | transforming, acidic coiled-coil containing protein 3 | 12826 | -0.152 | -0.1797 | Yes |
| 40 | KIF2C | KIF2C Entrez, Source | kinesin family member 2C | 12895 | -0.164 | -0.1460 | Yes |
| 41 | CCNB1 | CCNB1 Entrez, Source | cyclin B1 | 13126 | -0.245 | -0.1052 | Yes |
| 42 | KIAA0101 | KIAA0101 Entrez, Source | KIAA0101 | 13316 | -0.512 | 0.0020 | Yes |