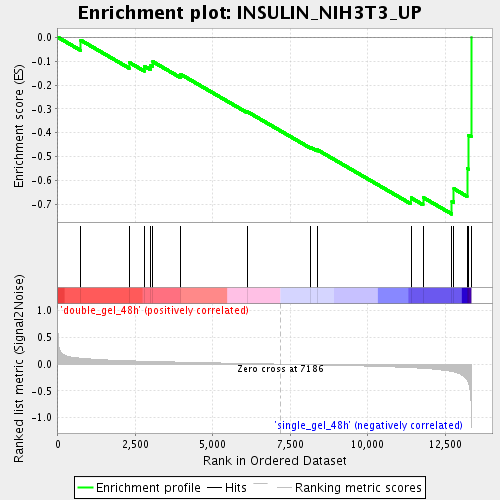
Profile of the Running ES Score & Positions of GeneSet Members on the Rank Ordered List
| Dataset | double_gel_and_single_gel_rma_expression_values_collapsed_to_symbols.class.cls #double_gel_48h_versus_single_gel_48h.class.cls #double_gel_48h_versus_single_gel_48h_repos |
| Phenotype | class.cls#double_gel_48h_versus_single_gel_48h_repos |
| Upregulated in class | single_gel_48h |
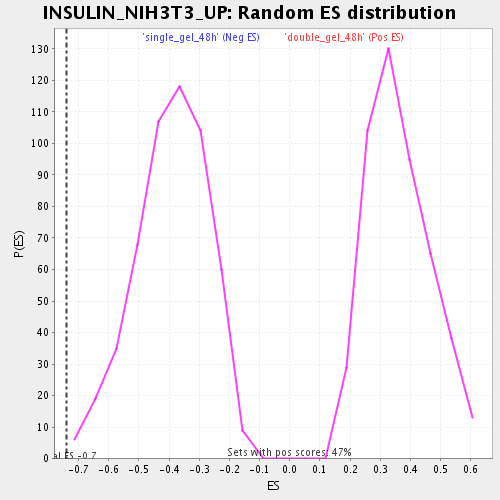
| GeneSet | INSULIN_NIH3T3_UP |
| Enrichment Score (ES) | -0.7406113 |
| Normalized Enrichment Score (NES) | -1.8782098 |
| Nominal p-value | 0.0038022813 |
| FDR q-value | 0.025894001 |
| FWER p-Value | 0.748 |
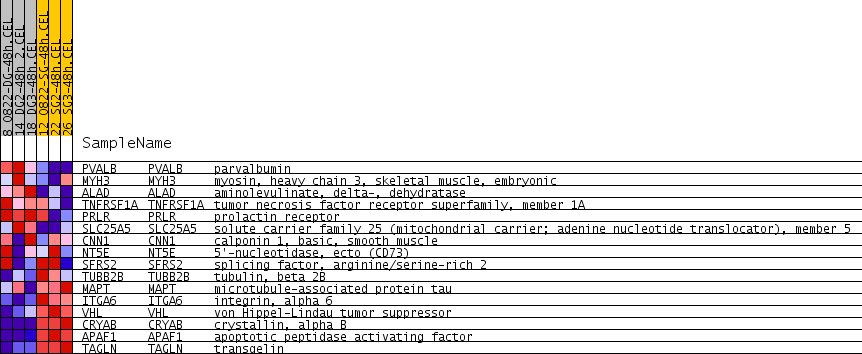
| PROBE | GENE SYMBOL | GENE_TITLE | RANK IN GENE LIST | RANK METRIC SCORE | RUNNING ES | CORE ENRICHMENT | |
|---|---|---|---|---|---|---|---|
| 1 | PVALB | PVALB Entrez, Source | parvalbumin | 738 | 0.109 | -0.0124 | No |
| 2 | MYH3 | MYH3 Entrez, Source | myosin, heavy chain 3, skeletal muscle, embryonic | 2301 | 0.062 | -0.1052 | No |
| 3 | ALAD | ALAD Entrez, Source | aminolevulinate, delta-, dehydratase | 2787 | 0.054 | -0.1206 | No |
| 4 | TNFRSF1A | TNFRSF1A Entrez, Source | tumor necrosis factor receptor superfamily, member 1A | 2994 | 0.050 | -0.1164 | No |
| 5 | PRLR | PRLR Entrez, Source | prolactin receptor | 3062 | 0.049 | -0.1021 | No |
| 6 | SLC25A5 | SLC25A5 Entrez, Source | solute carrier family 25 (mitochondrial carrier; adenine nucleotide translocator), member 5 | 3958 | 0.037 | -0.1547 | No |
| 7 | CNN1 | CNN1 Entrez, Source | calponin 1, basic, smooth muscle | 6113 | 0.012 | -0.3117 | No |
| 8 | NT5E | NT5E Entrez, Source | 5'-nucleotidase, ecto (CD73) | 8154 | -0.011 | -0.4604 | No |
| 9 | SFRS2 | SFRS2 Entrez, Source | splicing factor, arginine/serine-rich 2 | 8369 | -0.014 | -0.4710 | No |
| 10 | TUBB2B | TUBB2B Entrez, Source | tubulin, beta 2B | 11395 | -0.065 | -0.6724 | No |
| 11 | MAPT | MAPT Entrez, Source | microtubule-associated protein tau | 11785 | -0.078 | -0.6708 | No |
| 12 | ITGA6 | ITGA6 Entrez, Source | integrin, alpha 6 | 12716 | -0.137 | -0.6868 | Yes |
| 13 | VHL | VHL Entrez, Source | von Hippel-Lindau tumor suppressor | 12780 | -0.145 | -0.6346 | Yes |
| 14 | CRYAB | CRYAB Entrez, Source | crystallin, alpha B | 13206 | -0.298 | -0.5495 | Yes |
| 15 | APAF1 | APAF1 Entrez, Source | apoptotic peptidase activating factor | 13256 | -0.365 | -0.4098 | Yes |
| 16 | TAGLN | TAGLN Entrez, Source | transgelin | 13341 | -1.059 | 0.0001 | Yes |