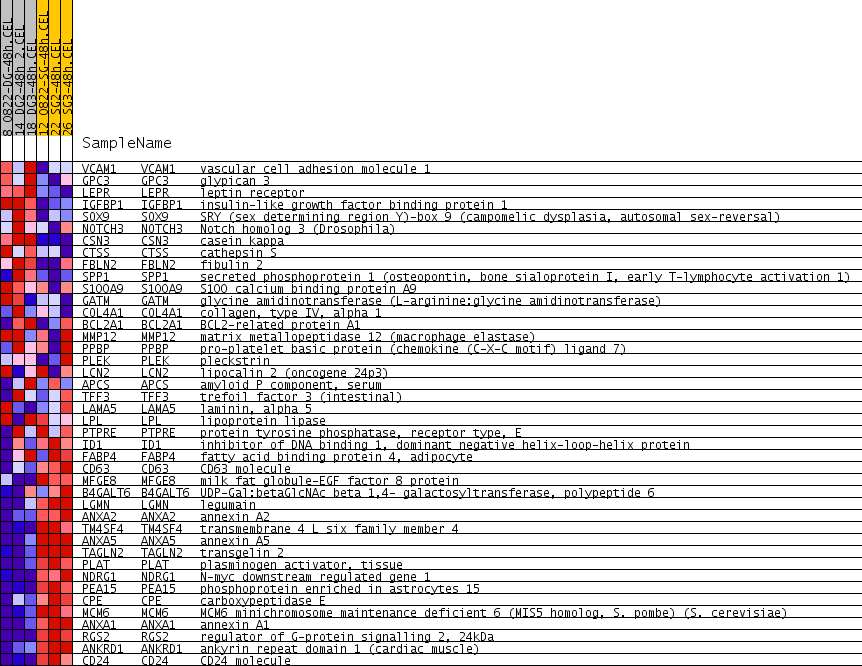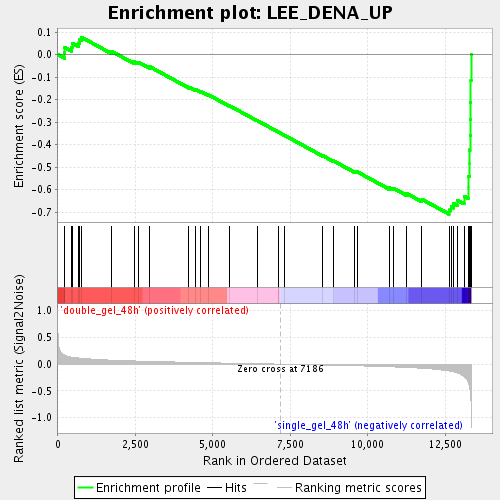
Profile of the Running ES Score & Positions of GeneSet Members on the Rank Ordered List
| Dataset | double_gel_and_single_gel_rma_expression_values_collapsed_to_symbols.class.cls #double_gel_48h_versus_single_gel_48h.class.cls #double_gel_48h_versus_single_gel_48h_repos |
| Phenotype | class.cls#double_gel_48h_versus_single_gel_48h_repos |
| Upregulated in class | single_gel_48h |
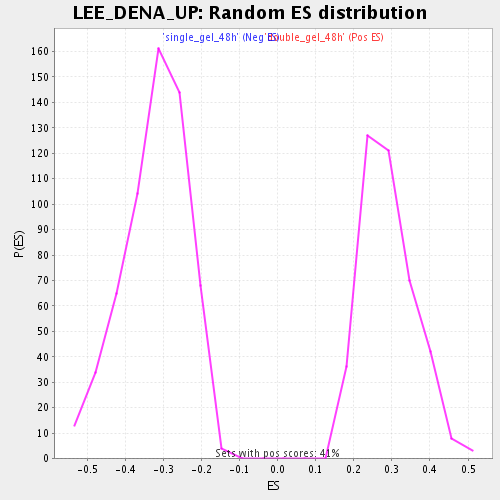
| GeneSet | LEE_DENA_UP |
| Enrichment Score (ES) | -0.7083246 |
| Normalized Enrichment Score (NES) | -2.1952794 |
| Nominal p-value | 0.0 |
| FDR q-value | 0.0014950249 |
| FWER p-Value | 0.0090 |
| PROBE | GENE SYMBOL | GENE_TITLE | RANK IN GENE LIST | RANK METRIC SCORE | RUNNING ES | CORE ENRICHMENT | |
|---|---|---|---|---|---|---|---|
| 1 | VCAM1 | VCAM1 Entrez, Source | vascular cell adhesion molecule 1 | 213 | 0.170 | 0.0085 | No |
| 2 | GPC3 | GPC3 Entrez, Source | glypican 3 | 221 | 0.167 | 0.0320 | No |
| 3 | LEPR | LEPR Entrez, Source | leptin receptor | 448 | 0.130 | 0.0338 | No |
| 4 | IGFBP1 | IGFBP1 Entrez, Source | insulin-like growth factor binding protein 1 | 459 | 0.129 | 0.0516 | No |
| 5 | SOX9 | SOX9 Entrez, Source | SRY (sex determining region Y)-box 9 (campomelic dysplasia, autosomal sex-reversal) | 676 | 0.113 | 0.0517 | No |
| 6 | NOTCH3 | NOTCH3 Entrez, Source | Notch homolog 3 (Drosophila) | 706 | 0.111 | 0.0656 | No |
| 7 | CSN3 | CSN3 Entrez, Source | casein kappa | 760 | 0.108 | 0.0773 | No |
| 8 | CTSS | CTSS Entrez, Source | cathepsin S | 1728 | 0.074 | 0.0152 | No |
| 9 | FBLN2 | FBLN2 Entrez, Source | fibulin 2 | 2463 | 0.059 | -0.0315 | No |
| 10 | SPP1 | SPP1 Entrez, Source | secreted phosphoprotein 1 (osteopontin, bone sialoprotein I, early T-lymphocyte activation 1) | 2593 | 0.057 | -0.0329 | No |
| 11 | S100A9 | S100A9 Entrez, Source | S100 calcium binding protein A9 | 2964 | 0.051 | -0.0535 | No |
| 12 | GATM | GATM Entrez, Source | glycine amidinotransferase (L-arginine:glycine amidinotransferase) | 4229 | 0.033 | -0.1437 | No |
| 13 | COL4A1 | COL4A1 Entrez, Source | collagen, type IV, alpha 1 | 4425 | 0.031 | -0.1539 | No |
| 14 | BCL2A1 | BCL2A1 Entrez, Source | BCL2-related protein A1 | 4610 | 0.029 | -0.1636 | No |
| 15 | MMP12 | MMP12 Entrez, Source | matrix metallopeptidase 12 (macrophage elastase) | 4861 | 0.026 | -0.1787 | No |
| 16 | PPBP | PPBP Entrez, Source | pro-platelet basic protein (chemokine (C-X-C motif) ligand 7) | 5528 | 0.018 | -0.2262 | No |
| 17 | PLEK | PLEK Entrez, Source | pleckstrin | 6431 | 0.008 | -0.2928 | No |
| 18 | LCN2 | LCN2 Entrez, Source | lipocalin 2 (oncogene 24p3) | 7114 | 0.001 | -0.3440 | No |
| 19 | APCS | APCS Entrez, Source | amyloid P component, serum | 7122 | 0.001 | -0.3444 | No |
| 20 | TFF3 | TFF3 Entrez, Source | trefoil factor 3 (intestinal) | 7322 | -0.002 | -0.3591 | No |
| 21 | LAMA5 | LAMA5 Entrez, Source | laminin, alpha 5 | 8549 | -0.016 | -0.4490 | No |
| 22 | LPL | LPL Entrez, Source | lipoprotein lipase | 8894 | -0.020 | -0.4719 | No |
| 23 | PTPRE | PTPRE Entrez, Source | protein tyrosine phosphatase, receptor type, E | 9579 | -0.030 | -0.5190 | No |
| 24 | ID1 | ID1 Entrez, Source | inhibitor of DNA binding 1, dominant negative helix-loop-helix protein | 9654 | -0.031 | -0.5200 | No |
| 25 | FABP4 | FABP4 Entrez, Source | fatty acid binding protein 4, adipocyte | 10699 | -0.049 | -0.5914 | No |
| 26 | CD63 | CD63 Entrez, Source | CD63 molecule | 10826 | -0.052 | -0.5934 | No |
| 27 | MFGE8 | MFGE8 Entrez, Source | milk fat globule-EGF factor 8 protein | 11250 | -0.061 | -0.6164 | No |
| 28 | B4GALT6 | B4GALT6 Entrez, Source | UDP-Gal:betaGlcNAc beta 1,4- galactosyltransferase, polypeptide 6 | 11749 | -0.077 | -0.6427 | No |
| 29 | LGMN | LGMN Entrez, Source | legumain | 12623 | -0.127 | -0.6900 | Yes |
| 30 | ANXA2 | ANXA2 Entrez, Source | annexin A2 | 12686 | -0.133 | -0.6754 | Yes |
| 31 | TM4SF4 | TM4SF4 Entrez, Source | transmembrane 4 L six family member 4 | 12767 | -0.144 | -0.6607 | Yes |
| 32 | ANXA5 | ANXA5 Entrez, Source | annexin A5 | 12886 | -0.162 | -0.6462 | Yes |
| 33 | TAGLN2 | TAGLN2 Entrez, Source | transgelin 2 | 13110 | -0.236 | -0.6290 | Yes |
| 34 | PLAT | PLAT Entrez, Source | plasminogen activator, tissue | 13241 | -0.343 | -0.5893 | Yes |
| 35 | NDRG1 | NDRG1 Entrez, Source | N-myc downstream regulated gene 1 | 13242 | -0.345 | -0.5396 | Yes |
| 36 | PEA15 | PEA15 Entrez, Source | phosphoprotein enriched in astrocytes 15 | 13282 | -0.412 | -0.4830 | Yes |
| 37 | CPE | CPE Entrez, Source | carboxypeptidase E | 13284 | -0.413 | -0.4235 | Yes |
| 38 | MCM6 | MCM6 Entrez, Source | MCM6 minichromosome maintenance deficient 6 (MIS5 homolog, S. pombe) (S. cerevisiae) | 13301 | -0.469 | -0.3570 | Yes |
| 39 | ANXA1 | ANXA1 Entrez, Source | annexin A1 | 13312 | -0.498 | -0.2859 | Yes |
| 40 | RGS2 | RGS2 Entrez, Source | regulator of G-protein signalling 2, 24kDa | 13320 | -0.525 | -0.2108 | Yes |
| 41 | ANKRD1 | ANKRD1 Entrez, Source | ankyrin repeat domain 1 (cardiac muscle) | 13330 | -0.666 | -0.1154 | Yes |
| 42 | CD24 | CD24 Entrez, Source | CD24 molecule | 13336 | -0.806 | 0.0005 | Yes |