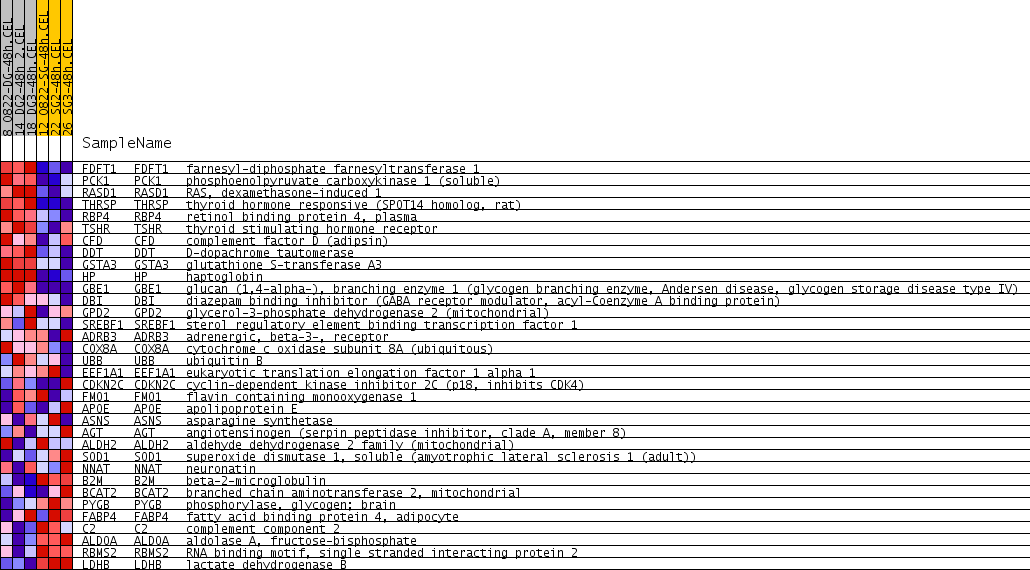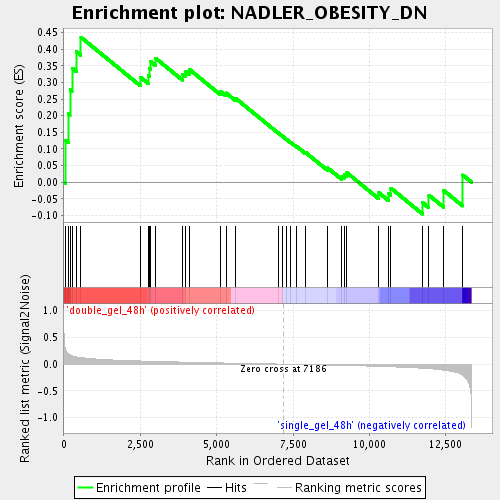
Profile of the Running ES Score & Positions of GeneSet Members on the Rank Ordered List
| Dataset | double_gel_and_single_gel_rma_expression_values_collapsed_to_symbols.class.cls #double_gel_48h_versus_single_gel_48h.class.cls #double_gel_48h_versus_single_gel_48h_repos |
| Phenotype | class.cls#double_gel_48h_versus_single_gel_48h_repos |
| Upregulated in class | double_gel_48h |
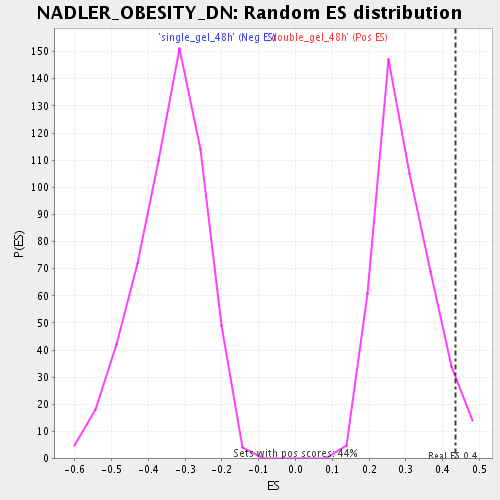
| GeneSet | NADLER_OBESITY_DN |
| Enrichment Score (ES) | 0.4359812 |
| Normalized Enrichment Score (NES) | 1.4677857 |
| Nominal p-value | 0.050574712 |
| FDR q-value | 0.1642779 |
| FWER p-Value | 1.0 |
| PROBE | GENE SYMBOL | GENE_TITLE | RANK IN GENE LIST | RANK METRIC SCORE | RUNNING ES | CORE ENRICHMENT | |
|---|---|---|---|---|---|---|---|
| 1 | FDFT1 | FDFT1 Entrez, Source | farnesyl-diphosphate farnesyltransferase 1 | 44 | 0.291 | 0.1269 | Yes |
| 2 | PCK1 | PCK1 Entrez, Source | phosphoenolpyruvate carboxykinase 1 (soluble) | 148 | 0.193 | 0.2055 | Yes |
| 3 | RASD1 | RASD1 Entrez, Source | RAS, dexamethasone-induced 1 | 200 | 0.173 | 0.2789 | Yes |
| 4 | THRSP | THRSP Entrez, Source | thyroid hormone responsive (SPOT14 homolog, rat) | 266 | 0.155 | 0.3434 | Yes |
| 5 | RBP4 | RBP4 Entrez, Source | retinol binding protein 4, plasma | 409 | 0.134 | 0.3928 | Yes |
| 6 | TSHR | TSHR Entrez, Source | thyroid stimulating hormone receptor | 557 | 0.121 | 0.4360 | Yes |
| 7 | CFD | CFD Entrez, Source | complement factor D (adipsin) | 2506 | 0.058 | 0.3157 | No |
| 8 | DDT | DDT Entrez, Source | D-dopachrome tautomerase | 2762 | 0.054 | 0.3207 | No |
| 9 | GSTA3 | GSTA3 Entrez, Source | glutathione S-transferase A3 | 2795 | 0.053 | 0.3422 | No |
| 10 | HP | HP Entrez, Source | haptoglobin | 2829 | 0.053 | 0.3633 | No |
| 11 | GBE1 | GBE1 Entrez, Source | glucan (1,4-alpha-), branching enzyme 1 (glycogen branching enzyme, Andersen disease, glycogen storage disease type IV) | 2997 | 0.050 | 0.3731 | No |
| 12 | DBI | DBI Entrez, Source | diazepam binding inhibitor (GABA receptor modulator, acyl-Coenzyme A binding protein) | 3877 | 0.038 | 0.3242 | No |
| 13 | GPD2 | GPD2 Entrez, Source | glycerol-3-phosphate dehydrogenase 2 (mitochondrial) | 3968 | 0.037 | 0.3339 | No |
| 14 | SREBF1 | SREBF1 Entrez, Source | sterol regulatory element binding transcription factor 1 | 4109 | 0.035 | 0.3391 | No |
| 15 | ADRB3 | ADRB3 Entrez, Source | adrenergic, beta-3-, receptor | 5128 | 0.022 | 0.2725 | No |
| 16 | COX8A | COX8A Entrez, Source | cytochrome c oxidase subunit 8A (ubiquitous) | 5305 | 0.020 | 0.2684 | No |
| 17 | UBB | UBB Entrez, Source | ubiquitin B | 5621 | 0.017 | 0.2523 | No |
| 18 | EEF1A1 | EEF1A1 Entrez, Source | eukaryotic translation elongation factor 1 alpha 1 | 7012 | 0.002 | 0.1486 | No |
| 19 | CDKN2C | CDKN2C Entrez, Source | cyclin-dependent kinase inhibitor 2C (p18, inhibits CDK4) | 7160 | 0.000 | 0.1377 | No |
| 20 | FMO1 | FMO1 Entrez, Source | flavin containing monooxygenase 1 | 7292 | -0.001 | 0.1284 | No |
| 21 | APOE | APOE Entrez, Source | apolipoprotein E | 7411 | -0.003 | 0.1208 | No |
| 22 | ASNS | ASNS Entrez, Source | asparagine synthetase | 7614 | -0.005 | 0.1078 | No |
| 23 | AGT | AGT Entrez, Source | angiotensinogen (serpin peptidase inhibitor, clade A, member 8) | 7909 | -0.008 | 0.0894 | No |
| 24 | ALDH2 | ALDH2 Entrez, Source | aldehyde dehydrogenase 2 family (mitochondrial) | 8630 | -0.017 | 0.0431 | No |
| 25 | SOD1 | SOD1 Entrez, Source | superoxide dismutase 1, soluble (amyotrophic lateral sclerosis 1 (adult)) | 9099 | -0.023 | 0.0182 | No |
| 26 | NNAT | NNAT Entrez, Source | neuronatin | 9178 | -0.024 | 0.0232 | No |
| 27 | B2M | B2M Entrez, Source | beta-2-microglobulin | 9260 | -0.025 | 0.0284 | No |
| 28 | BCAT2 | BCAT2 Entrez, Source | branched chain aminotransferase 2, mitochondrial | 10290 | -0.041 | -0.0304 | No |
| 29 | PYGB | PYGB Entrez, Source | phosphorylase, glycogen; brain | 10620 | -0.047 | -0.0340 | No |
| 30 | FABP4 | FABP4 Entrez, Source | fatty acid binding protein 4, adipocyte | 10699 | -0.049 | -0.0178 | No |
| 31 | C2 | C2 Entrez, Source | complement component 2 | 11739 | -0.077 | -0.0615 | No |
| 32 | ALDOA | ALDOA Entrez, Source | aldolase A, fructose-bisphosphate | 11945 | -0.085 | -0.0390 | No |
| 33 | RBMS2 | RBMS2 Entrez, Source | RNA binding motif, single stranded interacting protein 2 | 12431 | -0.113 | -0.0249 | No |
| 34 | LDHB | LDHB Entrez, Source | lactate dehydrogenase B | 13053 | -0.209 | 0.0217 | No |