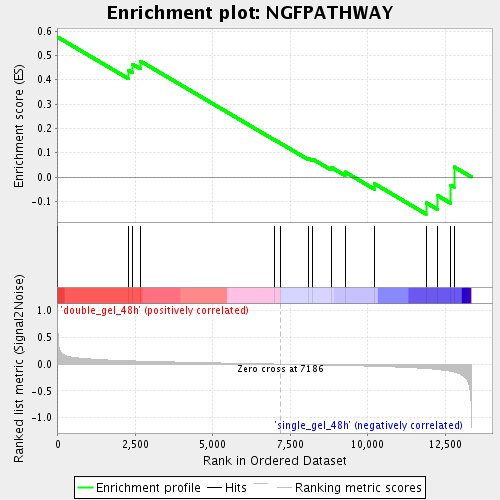
Profile of the Running ES Score & Positions of GeneSet Members on the Rank Ordered List
| Dataset | double_gel_and_single_gel_rma_expression_values_collapsed_to_symbols.class.cls #double_gel_48h_versus_single_gel_48h.class.cls #double_gel_48h_versus_single_gel_48h_repos |
| Phenotype | class.cls#double_gel_48h_versus_single_gel_48h_repos |
| Upregulated in class | double_gel_48h |
| GeneSet | NGFPATHWAY |
| Enrichment Score (ES) | 0.5748037 |
| Normalized Enrichment Score (NES) | 1.5422076 |
| Nominal p-value | 0.0472973 |
| FDR q-value | 0.12411849 |
| FWER p-Value | 1.0 |
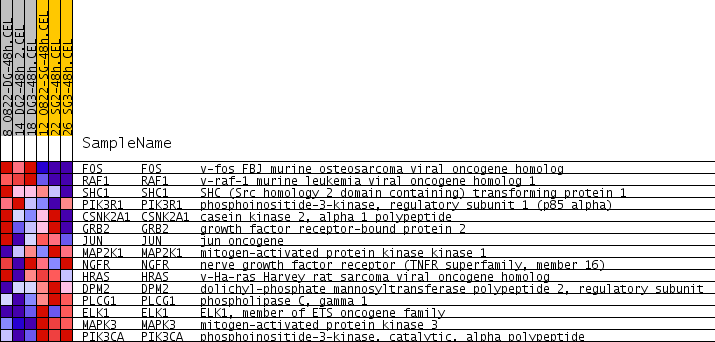
| PROBE | GENE SYMBOL | GENE_TITLE | RANK IN GENE LIST | RANK METRIC SCORE | RUNNING ES | CORE ENRICHMENT | |
|---|---|---|---|---|---|---|---|
| 1 | FOS | FOS Entrez, Source | v-fos FBJ murine osteosarcoma viral oncogene homolog | 0 | 1.012 | 0.5748 | Yes |
| 2 | RAF1 | RAF1 Entrez, Source | v-raf-1 murine leukemia viral oncogene homolog 1 | 2284 | 0.062 | 0.4390 | No |
| 3 | SHC1 | SHC1 Entrez, Source | SHC (Src homology 2 domain containing) transforming protein 1 | 2417 | 0.060 | 0.4632 | No |
| 4 | PIK3R1 | PIK3R1 Entrez, Source | phosphoinositide-3-kinase, regulatory subunit 1 (p85 alpha) | 2668 | 0.056 | 0.4762 | No |
| 5 | CSNK2A1 | CSNK2A1 Entrez, Source | casein kinase 2, alpha 1 polypeptide | 6997 | 0.002 | 0.1525 | No |
| 6 | GRB2 | GRB2 Entrez, Source | growth factor receptor-bound protein 2 | 7179 | 0.000 | 0.1390 | No |
| 7 | JUN | JUN Entrez, Source | jun oncogene | 8081 | -0.010 | 0.0773 | No |
| 8 | MAP2K1 | MAP2K1 Entrez, Source | mitogen-activated protein kinase kinase 1 | 8219 | -0.012 | 0.0738 | No |
| 9 | NGFR | NGFR Entrez, Source | nerve growth factor receptor (TNFR superfamily, member 16) | 8817 | -0.019 | 0.0400 | No |
| 10 | HRAS | HRAS Entrez, Source | v-Ha-ras Harvey rat sarcoma viral oncogene homolog | 9267 | -0.025 | 0.0208 | No |
| 11 | DPM2 | DPM2 Entrez, Source | dolichyl-phosphate mannosyltransferase polypeptide 2, regulatory subunit | 10215 | -0.040 | -0.0274 | No |
| 12 | PLCG1 | PLCG1 Entrez, Source | phospholipase C, gamma 1 | 11883 | -0.083 | -0.1056 | No |
| 13 | ELK1 | ELK1 Entrez, Source | ELK1, member of ETS oncogene family | 12262 | -0.100 | -0.0769 | No |
| 14 | MAPK3 | MAPK3 Entrez, Source | mitogen-activated protein kinase 3 | 12674 | -0.132 | -0.0329 | No |
| 15 | PIK3CA | PIK3CA Entrez, Source | phosphoinositide-3-kinase, catalytic, alpha polypeptide | 12788 | -0.146 | 0.0416 | No |