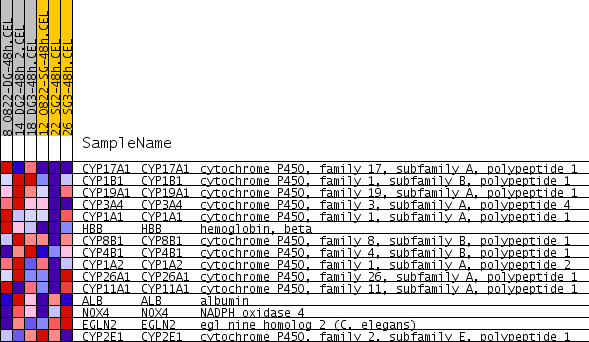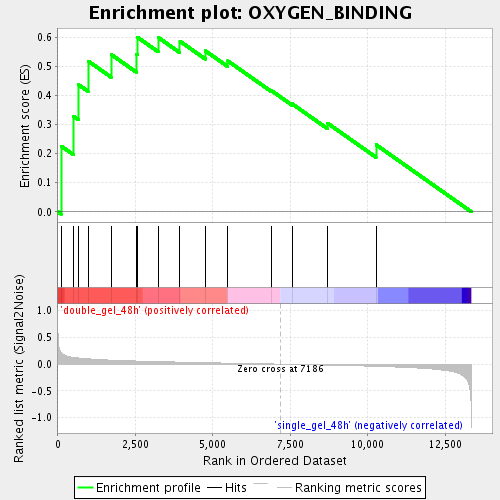
Profile of the Running ES Score & Positions of GeneSet Members on the Rank Ordered List
| Dataset | double_gel_and_single_gel_rma_expression_values_collapsed_to_symbols.class.cls #double_gel_48h_versus_single_gel_48h.class.cls #double_gel_48h_versus_single_gel_48h_repos |
| Phenotype | class.cls#double_gel_48h_versus_single_gel_48h_repos |
| Upregulated in class | double_gel_48h |
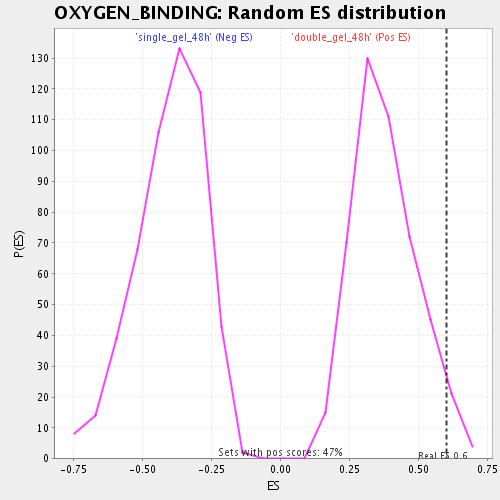
| GeneSet | OXYGEN_BINDING |
| Enrichment Score (ES) | 0.6000972 |
| Normalized Enrichment Score (NES) | 1.5824339 |
| Nominal p-value | 0.042735044 |
| FDR q-value | 0.10233358 |
| FWER p-Value | 1.0 |
| PROBE | GENE SYMBOL | GENE_TITLE | RANK IN GENE LIST | RANK METRIC SCORE | RUNNING ES | CORE ENRICHMENT | |
|---|---|---|---|---|---|---|---|
| 1 | CYP17A1 | CYP17A1 Entrez, Source | cytochrome P450, family 17, subfamily A, polypeptide 1 | 103 | 0.220 | 0.2262 | Yes |
| 2 | CYP1B1 | CYP1B1 Entrez, Source | cytochrome P450, family 1, subfamily B, polypeptide 1 | 506 | 0.124 | 0.3281 | Yes |
| 3 | CYP19A1 | CYP19A1 Entrez, Source | cytochrome P450, family 19, subfamily A, polypeptide 1 | 670 | 0.114 | 0.4366 | Yes |
| 4 | CYP3A4 | CYP3A4 Entrez, Source | cytochrome P450, family 3, subfamily A, polypeptide 4 | 975 | 0.099 | 0.5184 | Yes |
| 5 | CYP1A1 | CYP1A1 Entrez, Source | cytochrome P450, family 1, subfamily A, polypeptide 1 | 1719 | 0.074 | 0.5409 | Yes |
| 6 | HBB | HBB Entrez, Source | hemoglobin, beta | 2529 | 0.058 | 0.5418 | Yes |
| 7 | CYP8B1 | CYP8B1 Entrez, Source | cytochrome P450, family 8, subfamily B, polypeptide 1 | 2566 | 0.057 | 0.6001 | Yes |
| 8 | CYP4B1 | CYP4B1 Entrez, Source | cytochrome P450, family 4, subfamily B, polypeptide 1 | 3238 | 0.047 | 0.5993 | No |
| 9 | CYP1A2 | CYP1A2 Entrez, Source | cytochrome P450, family 1, subfamily A, polypeptide 2 | 3939 | 0.037 | 0.5864 | No |
| 10 | CYP26A1 | CYP26A1 Entrez, Source | cytochrome P450, family 26, subfamily A, polypeptide 1 | 4758 | 0.027 | 0.5535 | No |
| 11 | CYP11A1 | CYP11A1 Entrez, Source | cytochrome P450, family 11, subfamily A, polypeptide 1 | 5484 | 0.019 | 0.5187 | No |
| 12 | ALB | ALB Entrez, Source | albumin | 6888 | 0.003 | 0.4168 | No |
| 13 | NOX4 | NOX4 Entrez, Source | NADPH oxidase 4 | 7556 | -0.004 | 0.3714 | No |
| 14 | EGLN2 | EGLN2 Entrez, Source | egl nine homolog 2 (C. elegans) | 8706 | -0.018 | 0.3044 | No |
| 15 | CYP2E1 | CYP2E1 Entrez, Source | cytochrome P450, family 2, subfamily E, polypeptide 1 | 10268 | -0.041 | 0.2306 | No |