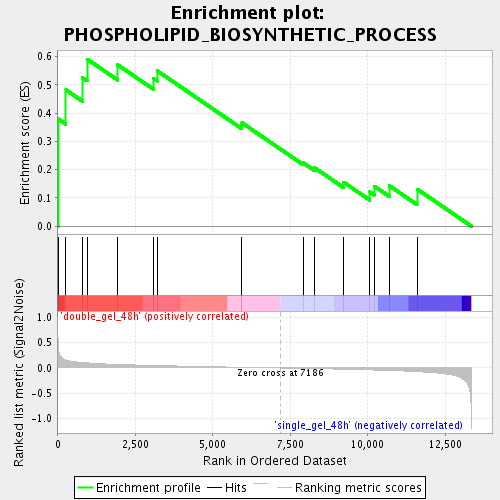
Profile of the Running ES Score & Positions of GeneSet Members on the Rank Ordered List
| Dataset | double_gel_and_single_gel_rma_expression_values_collapsed_to_symbols.class.cls #double_gel_48h_versus_single_gel_48h.class.cls #double_gel_48h_versus_single_gel_48h_repos |
| Phenotype | class.cls#double_gel_48h_versus_single_gel_48h_repos |
| Upregulated in class | double_gel_48h |
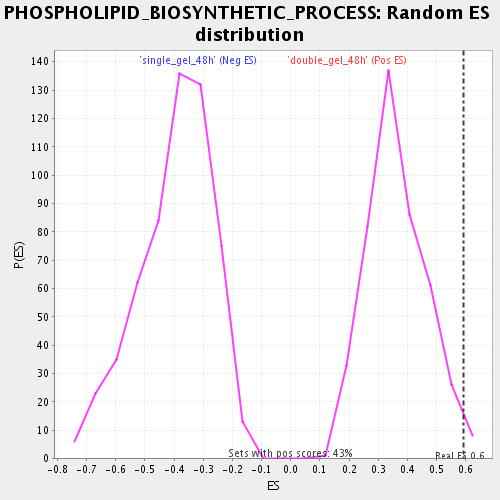
| GeneSet | PHOSPHOLIPID_BIOSYNTHETIC_PROCESS |
| Enrichment Score (ES) | 0.59118104 |
| Normalized Enrichment Score (NES) | 1.626612 |
| Nominal p-value | 0.016129032 |
| FDR q-value | 0.08534454 |
| FWER p-Value | 1.0 |
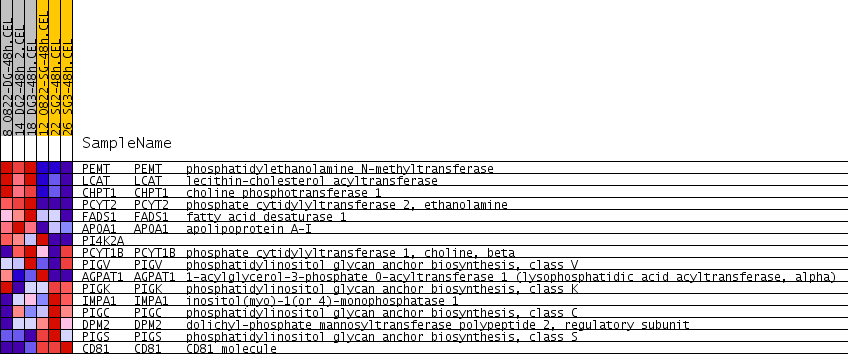
| PROBE | GENE SYMBOL | GENE_TITLE | RANK IN GENE LIST | RANK METRIC SCORE | RUNNING ES | CORE ENRICHMENT | |
|---|---|---|---|---|---|---|---|
| 1 | PEMT | PEMT Entrez, Source | phosphatidylethanolamine N-methyltransferase | 4 | 0.491 | 0.3798 | Yes |
| 2 | LCAT | LCAT Entrez, Source | lecithin-cholesterol acyltransferase | 259 | 0.157 | 0.4824 | Yes |
| 3 | CHPT1 | CHPT1 Entrez, Source | choline phosphotransferase 1 | 789 | 0.107 | 0.5257 | Yes |
| 4 | PCYT2 | PCYT2 Entrez, Source | phosphate cytidylyltransferase 2, ethanolamine | 944 | 0.100 | 0.5912 | Yes |
| 5 | FADS1 | FADS1 Entrez, Source | fatty acid desaturase 1 | 1932 | 0.070 | 0.5709 | No |
| 6 | APOA1 | APOA1 Entrez, Source | apolipoprotein A-I | 3081 | 0.049 | 0.5226 | No |
| 7 | PI4K2A | 3202 | 0.047 | 0.5501 | No | ||
| 8 | PCYT1B | PCYT1B Entrez, Source | phosphate cytidylyltransferase 1, choline, beta | 5923 | 0.014 | 0.3566 | No |
| 9 | PIGV | PIGV Entrez, Source | phosphatidylinositol glycan anchor biosynthesis, class V | 5939 | 0.013 | 0.3658 | No |
| 10 | AGPAT1 | AGPAT1 Entrez, Source | 1-acylglycerol-3-phosphate O-acyltransferase 1 (lysophosphatidic acid acyltransferase, alpha) | 7919 | -0.009 | 0.2239 | No |
| 11 | PIGK | PIGK Entrez, Source | phosphatidylinositol glycan anchor biosynthesis, class K | 8287 | -0.013 | 0.2064 | No |
| 12 | IMPA1 | IMPA1 Entrez, Source | inositol(myo)-1(or 4)-monophosphatase 1 | 9219 | -0.025 | 0.1556 | No |
| 13 | PIGC | PIGC Entrez, Source | phosphatidylinositol glycan anchor biosynthesis, class C | 10066 | -0.038 | 0.1213 | No |
| 14 | DPM2 | DPM2 Entrez, Source | dolichyl-phosphate mannosyltransferase polypeptide 2, regulatory subunit | 10215 | -0.040 | 0.1413 | No |
| 15 | PIGS | PIGS Entrez, Source | phosphatidylinositol glycan anchor biosynthesis, class S | 10690 | -0.049 | 0.1436 | No |
| 16 | CD81 | CD81 Entrez, Source | CD81 molecule | 11591 | -0.072 | 0.1314 | No |