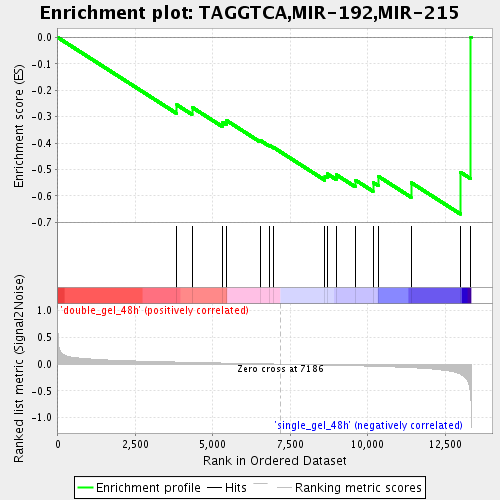
Profile of the Running ES Score & Positions of GeneSet Members on the Rank Ordered List
| Dataset | double_gel_and_single_gel_rma_expression_values_collapsed_to_symbols.class.cls #double_gel_48h_versus_single_gel_48h.class.cls #double_gel_48h_versus_single_gel_48h_repos |
| Phenotype | class.cls#double_gel_48h_versus_single_gel_48h_repos |
| Upregulated in class | single_gel_48h |
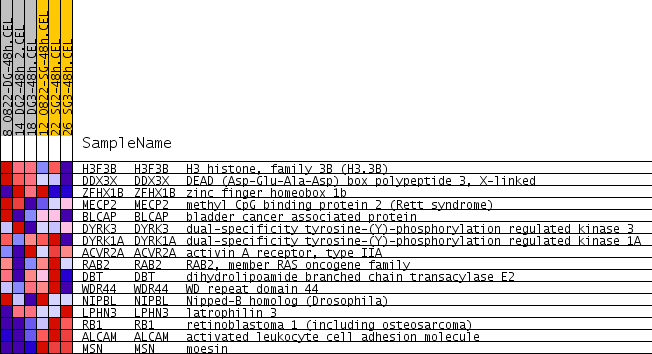
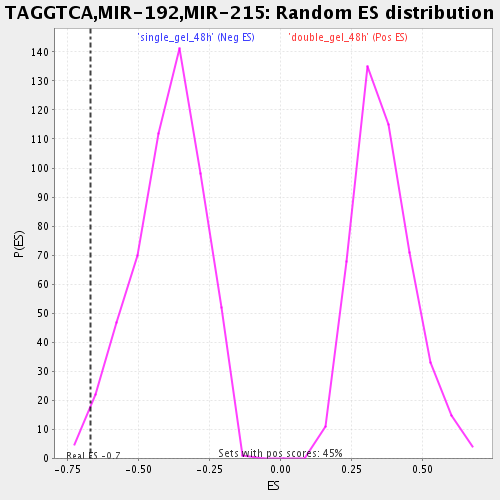
| GeneSet | TAGGTCA,MIR-192,MIR-215 |
| Enrichment Score (ES) | -0.6686951 |
| Normalized Enrichment Score (NES) | -1.6912937 |
| Nominal p-value | 0.01459854 |
| FDR q-value | 0.071068086 |
| FWER p-Value | 1.0 |
| PROBE | GENE SYMBOL | GENE_TITLE | RANK IN GENE LIST | RANK METRIC SCORE | RUNNING ES | CORE ENRICHMENT | |
|---|---|---|---|---|---|---|---|
| 1 | H3F3B | H3F3B Entrez, Source | H3 histone, family 3B (H3.3B) | 3836 | 0.039 | -0.2547 | No |
| 2 | DDX3X | DDX3X Entrez, Source | DEAD (Asp-Glu-Ala-Asp) box polypeptide 3, X-linked | 4329 | 0.032 | -0.2641 | No |
| 3 | ZFHX1B | ZFHX1B Entrez, Source | zinc finger homeobox 1b | 5318 | 0.020 | -0.3210 | No |
| 4 | MECP2 | MECP2 Entrez, Source | methyl CpG binding protein 2 (Rett syndrome) | 5444 | 0.019 | -0.3143 | No |
| 5 | BLCAP | BLCAP Entrez, Source | bladder cancer associated protein | 6524 | 0.007 | -0.3891 | No |
| 6 | DYRK3 | DYRK3 Entrez, Source | dual-specificity tyrosine-(Y)-phosphorylation regulated kinase 3 | 6818 | 0.004 | -0.4077 | No |
| 7 | DYRK1A | DYRK1A Entrez, Source | dual-specificity tyrosine-(Y)-phosphorylation regulated kinase 1A | 6964 | 0.002 | -0.4166 | No |
| 8 | ACVR2A | ACVR2A Entrez, Source | activin A receptor, type IIA | 8618 | -0.017 | -0.5260 | No |
| 9 | RAB2 | RAB2 Entrez, Source | RAB2, member RAS oncogene family | 8693 | -0.018 | -0.5163 | No |
| 10 | DBT | DBT Entrez, Source | dihydrolipoamide branched chain transacylase E2 | 8987 | -0.022 | -0.5198 | No |
| 11 | WDR44 | WDR44 Entrez, Source | WD repeat domain 44 | 9598 | -0.030 | -0.5396 | No |
| 12 | NIPBL | NIPBL Entrez, Source | Nipped-B homolog (Drosophila) | 10173 | -0.039 | -0.5490 | No |
| 13 | LPHN3 | LPHN3 Entrez, Source | latrophilin 3 | 10341 | -0.042 | -0.5256 | No |
| 14 | RB1 | RB1 Entrez, Source | retinoblastoma 1 (including osteosarcoma) | 11401 | -0.065 | -0.5495 | Yes |
| 15 | ALCAM | ALCAM Entrez, Source | activated leukocyte cell adhesion molecule | 12991 | -0.186 | -0.5099 | Yes |
| 16 | MSN | MSN Entrez, Source | moesin | 13327 | -0.629 | 0.0011 | Yes |