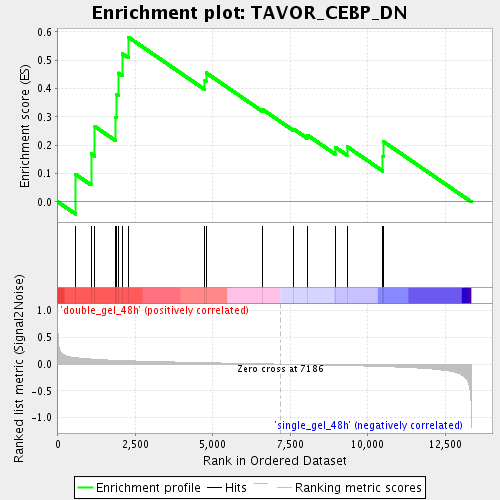
Profile of the Running ES Score & Positions of GeneSet Members on the Rank Ordered List
| Dataset | double_gel_and_single_gel_rma_expression_values_collapsed_to_symbols.class.cls #double_gel_48h_versus_single_gel_48h.class.cls #double_gel_48h_versus_single_gel_48h_repos |
| Phenotype | class.cls#double_gel_48h_versus_single_gel_48h_repos |
| Upregulated in class | double_gel_48h |
| GeneSet | TAVOR_CEBP_DN |
| Enrichment Score (ES) | 0.58077323 |
| Normalized Enrichment Score (NES) | 1.609193 |
| Nominal p-value | 0.029787235 |
| FDR q-value | 0.09119532 |
| FWER p-Value | 1.0 |
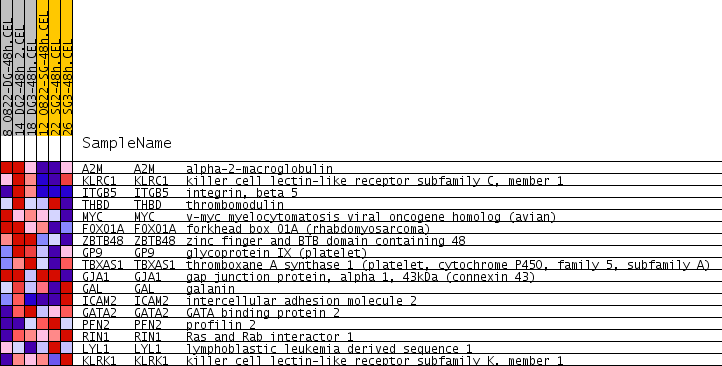
| PROBE | GENE SYMBOL | GENE_TITLE | RANK IN GENE LIST | RANK METRIC SCORE | RUNNING ES | CORE ENRICHMENT | |
|---|---|---|---|---|---|---|---|
| 1 | A2M | A2M Entrez, Source | alpha-2-macroglobulin | 573 | 0.120 | 0.0971 | Yes |
| 2 | KLRC1 | KLRC1 Entrez, Source | killer cell lectin-like receptor subfamily C, member 1 | 1071 | 0.095 | 0.1702 | Yes |
| 3 | ITGB5 | ITGB5 Entrez, Source | integrin, beta 5 | 1194 | 0.090 | 0.2659 | Yes |
| 4 | THBD | THBD Entrez, Source | thrombomodulin | 1858 | 0.071 | 0.2989 | Yes |
| 5 | MYC | MYC Entrez, Source | v-myc myelocytomatosis viral oncogene homolog (avian) | 1896 | 0.070 | 0.3780 | Yes |
| 6 | FOXO1A | FOXO1A Entrez, Source | forkhead box O1A (rhabdomyosarcoma) | 1951 | 0.069 | 0.4547 | Yes |
| 7 | ZBTB48 | ZBTB48 Entrez, Source | zinc finger and BTB domain containing 48 | 2086 | 0.066 | 0.5220 | Yes |
| 8 | GP9 | GP9 Entrez, Source | glycoprotein IX (platelet) | 2278 | 0.063 | 0.5808 | Yes |
| 9 | TBXAS1 | TBXAS1 Entrez, Source | thromboxane A synthase 1 (platelet, cytochrome P450, family 5, subfamily A) | 4744 | 0.027 | 0.4273 | No |
| 10 | GJA1 | GJA1 Entrez, Source | gap junction protein, alpha 1, 43kDa (connexin 43) | 4783 | 0.027 | 0.4555 | No |
| 11 | GAL | GAL Entrez, Source | galanin | 6616 | 0.006 | 0.3254 | No |
| 12 | ICAM2 | ICAM2 Entrez, Source | intercellular adhesion molecule 2 | 7616 | -0.005 | 0.2563 | No |
| 13 | GATA2 | GATA2 Entrez, Source | GATA binding protein 2 | 8055 | -0.010 | 0.2352 | No |
| 14 | PFN2 | PFN2 Entrez, Source | profilin 2 | 8946 | -0.021 | 0.1932 | No |
| 15 | RIN1 | RIN1 Entrez, Source | Ras and Rab interactor 1 | 9335 | -0.026 | 0.1949 | No |
| 16 | LYL1 | LYL1 Entrez, Source | lymphoblastic leukemia derived sequence 1 | 10489 | -0.045 | 0.1609 | No |
| 17 | KLRK1 | KLRK1 Entrez, Source | killer cell lectin-like receptor subfamily K, member 1 | 10508 | -0.045 | 0.2127 | No |