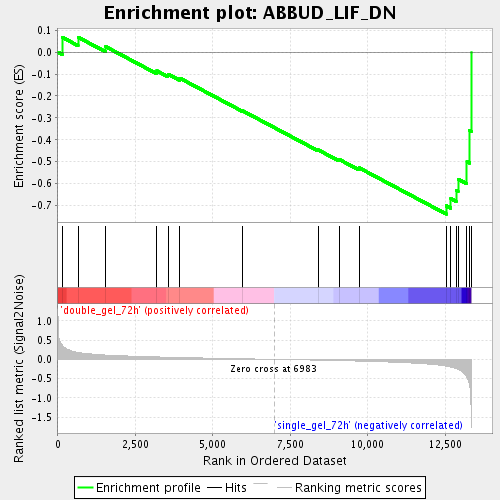
Profile of the Running ES Score & Positions of GeneSet Members on the Rank Ordered List
| Dataset | double_gel_and_single_gel_rma_expression_values_collapsed_to_symbols.class.cls #double_gel_72h_versus_single_gel_72h.class.cls #double_gel_72h_versus_single_gel_72h_repos |
| Phenotype | class.cls#double_gel_72h_versus_single_gel_72h_repos |
| Upregulated in class | single_gel_72h |
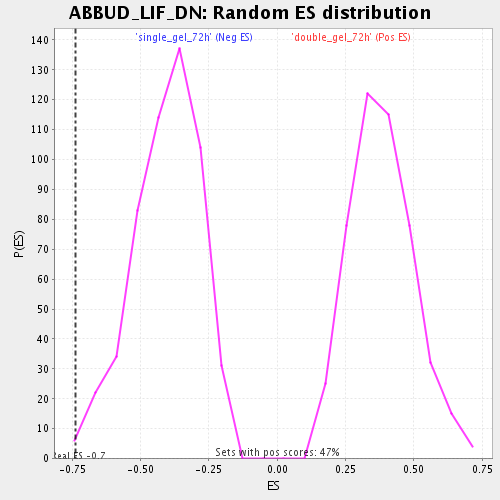
| GeneSet | ABBUD_LIF_DN |
| Enrichment Score (ES) | -0.7387993 |
| Normalized Enrichment Score (NES) | -1.8203822 |
| Nominal p-value | 0.0037664783 |
| FDR q-value | 0.0331243 |
| FWER p-Value | 0.915 |
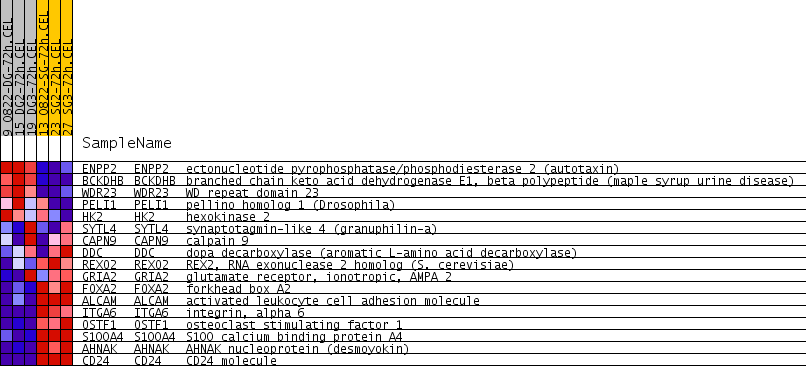
| PROBE | GENE SYMBOL | GENE_TITLE | RANK IN GENE LIST | RANK METRIC SCORE | RUNNING ES | CORE ENRICHMENT | |
|---|---|---|---|---|---|---|---|
| 1 | ENPP2 | ENPP2 Entrez, Source | ectonucleotide pyrophosphatase/phosphodiesterase 2 (autotaxin) | 143 | 0.363 | 0.0674 | No |
| 2 | BCKDHB | BCKDHB Entrez, Source | branched chain keto acid dehydrogenase E1, beta polypeptide (maple syrup urine disease) | 651 | 0.179 | 0.0679 | No |
| 3 | WDR23 | WDR23 Entrez, Source | WD repeat domain 23 | 1544 | 0.111 | 0.0249 | No |
| 4 | PELI1 | PELI1 Entrez, Source | pellino homolog 1 (Drosophila) | 3195 | 0.062 | -0.0855 | No |
| 5 | HK2 | HK2 Entrez, Source | hexokinase 2 | 3553 | 0.055 | -0.1005 | No |
| 6 | SYTL4 | SYTL4 Entrez, Source | synaptotagmin-like 4 (granuphilin-a) | 3924 | 0.048 | -0.1180 | No |
| 7 | CAPN9 | CAPN9 Entrez, Source | calpain 9 | 5952 | 0.015 | -0.2669 | No |
| 8 | DDC | DDC Entrez, Source | dopa decarboxylase (aromatic L-amino acid decarboxylase) | 8401 | -0.021 | -0.4460 | No |
| 9 | REXO2 | REXO2 Entrez, Source | REX2, RNA exonuclease 2 homolog (S. cerevisiae) | 9073 | -0.034 | -0.4892 | No |
| 10 | GRIA2 | GRIA2 Entrez, Source | glutamate receptor, ionotropic, AMPA 2 | 9719 | -0.046 | -0.5276 | No |
| 11 | FOXA2 | FOXA2 Entrez, Source | forkhead box A2 | 12534 | -0.176 | -0.7009 | Yes |
| 12 | ALCAM | ALCAM Entrez, Source | activated leukocyte cell adhesion molecule | 12680 | -0.201 | -0.6686 | Yes |
| 13 | ITGA6 | ITGA6 Entrez, Source | integrin, alpha 6 | 12855 | -0.239 | -0.6302 | Yes |
| 14 | OSTF1 | OSTF1 Entrez, Source | osteoclast stimulating factor 1 | 12916 | -0.257 | -0.5793 | Yes |
| 15 | S100A4 | S100A4 Entrez, Source | S100 calcium binding protein A4 | 13202 | -0.468 | -0.5000 | Yes |
| 16 | AHNAK | AHNAK Entrez, Source | AHNAK nucleoprotein (desmoyokin) | 13286 | -0.695 | -0.3565 | Yes |
| 17 | CD24 | CD24 Entrez, Source | CD24 molecule | 13341 | -1.675 | 0.0001 | Yes |