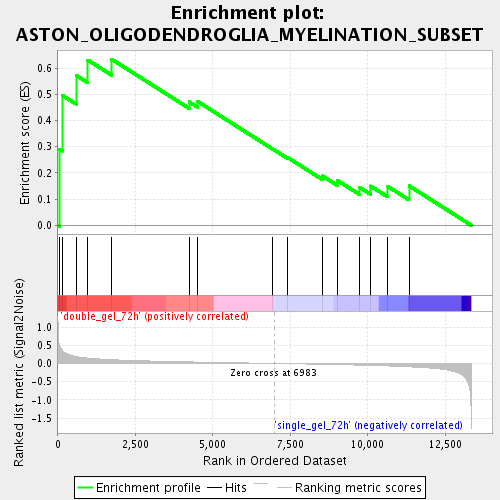
Profile of the Running ES Score & Positions of GeneSet Members on the Rank Ordered List
| Dataset | double_gel_and_single_gel_rma_expression_values_collapsed_to_symbols.class.cls #double_gel_72h_versus_single_gel_72h.class.cls #double_gel_72h_versus_single_gel_72h_repos |
| Phenotype | class.cls#double_gel_72h_versus_single_gel_72h_repos |
| Upregulated in class | double_gel_72h |
| GeneSet | ASTON_OLIGODENDROGLIA_MYELINATION_SUBSET |
| Enrichment Score (ES) | 0.63378483 |
| Normalized Enrichment Score (NES) | 1.597849 |
| Nominal p-value | 0.038539555 |
| FDR q-value | 0.070590034 |
| FWER p-Value | 1.0 |
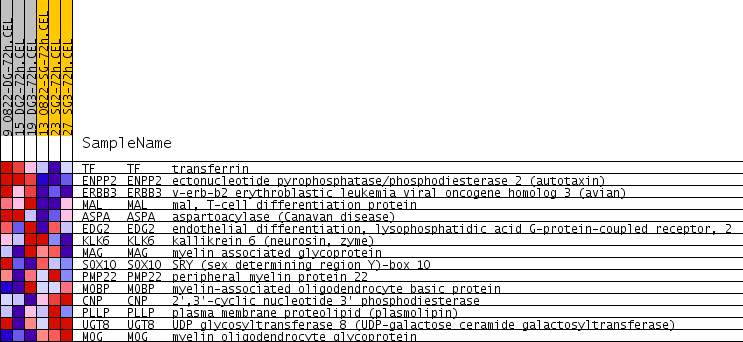
| PROBE | GENE SYMBOL | GENE_TITLE | RANK IN GENE LIST | RANK METRIC SCORE | RUNNING ES | CORE ENRICHMENT | |
|---|---|---|---|---|---|---|---|
| 1 | TF | TF Entrez, Source | transferrin | 48 | 0.502 | 0.2903 | Yes |
| 2 | ENPP2 | ENPP2 Entrez, Source | ectonucleotide pyrophosphatase/phosphodiesterase 2 (autotaxin) | 143 | 0.363 | 0.4958 | Yes |
| 3 | ERBB3 | ERBB3 Entrez, Source | v-erb-b2 erythroblastic leukemia viral oncogene homolog 3 (avian) | 588 | 0.187 | 0.5722 | Yes |
| 4 | MAL | MAL Entrez, Source | mal, T-cell differentiation protein | 964 | 0.148 | 0.6306 | Yes |
| 5 | ASPA | ASPA Entrez, Source | aspartoacylase (Canavan disease) | 1733 | 0.104 | 0.6338 | Yes |
| 6 | EDG2 | EDG2 Entrez, Source | endothelial differentiation, lysophosphatidic acid G-protein-coupled receptor, 2 | 4234 | 0.042 | 0.4710 | No |
| 7 | KLK6 | KLK6 Entrez, Source | kallikrein 6 (neurosin, zyme) | 4508 | 0.038 | 0.4726 | No |
| 8 | MAG | MAG Entrez, Source | myelin associated glycoprotein | 6930 | 0.001 | 0.2913 | No |
| 9 | SOX10 | SOX10 Entrez, Source | SRY (sex determining region Y)-box 10 | 7415 | -0.006 | 0.2586 | No |
| 10 | PMP22 | PMP22 Entrez, Source | peripheral myelin protein 22 | 8539 | -0.024 | 0.1883 | No |
| 11 | MOBP | MOBP Entrez, Source | myelin-associated oligodendrocyte basic protein | 9009 | -0.032 | 0.1720 | No |
| 12 | CNP | CNP Entrez, Source | 2',3'-cyclic nucleotide 3' phosphodiesterase | 9734 | -0.046 | 0.1449 | No |
| 13 | PLLP | PLLP Entrez, Source | plasma membrane proteolipid (plasmolipin) | 10089 | -0.054 | 0.1500 | No |
| 14 | UGT8 | UGT8 Entrez, Source | UDP glycosyltransferase 8 (UDP-galactose ceramide galactosyltransferase) | 10649 | -0.068 | 0.1481 | No |
| 15 | MOG | MOG Entrez, Source | myelin oligodendrocyte glycoprotein | 11332 | -0.092 | 0.1508 | No |