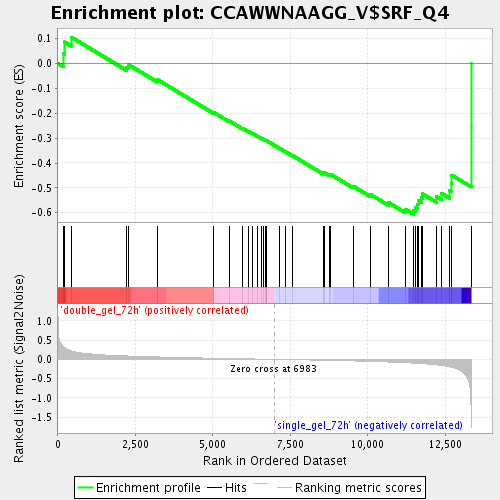
Profile of the Running ES Score & Positions of GeneSet Members on the Rank Ordered List
| Dataset | double_gel_and_single_gel_rma_expression_values_collapsed_to_symbols.class.cls #double_gel_72h_versus_single_gel_72h.class.cls #double_gel_72h_versus_single_gel_72h_repos |
| Phenotype | class.cls#double_gel_72h_versus_single_gel_72h_repos |
| Upregulated in class | single_gel_72h |
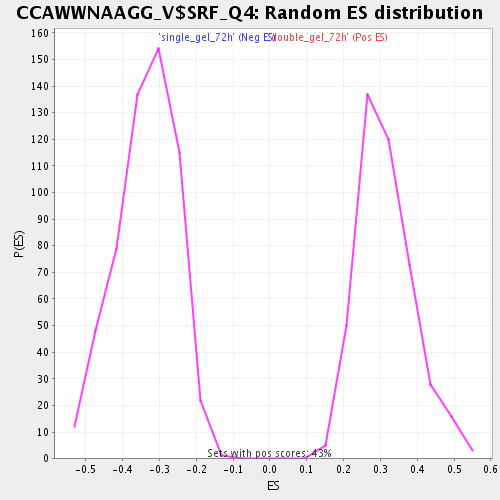
| GeneSet | CCAWWNAAGG_V$SRF_Q4 |
| Enrichment Score (ES) | -0.6053229 |
| Normalized Enrichment Score (NES) | -1.8083417 |
| Nominal p-value | 0.0 |
| FDR q-value | 0.03634275 |
| FWER p-Value | 0.946 |
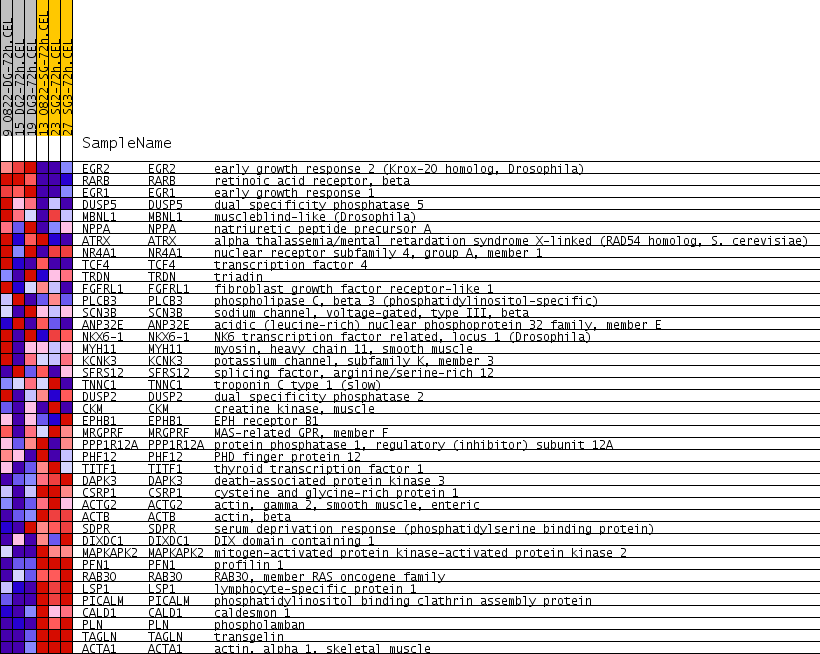
| PROBE | GENE SYMBOL | GENE_TITLE | RANK IN GENE LIST | RANK METRIC SCORE | RUNNING ES | CORE ENRICHMENT | |
|---|---|---|---|---|---|---|---|
| 1 | EGR2 | EGR2 Entrez, Source | early growth response 2 (Krox-20 homolog, Drosophila) | 180 | 0.328 | 0.0397 | No |
| 2 | RARB | RARB Entrez, Source | retinoic acid receptor, beta | 214 | 0.304 | 0.0865 | No |
| 3 | EGR1 | EGR1 Entrez, Source | early growth response 1 | 437 | 0.219 | 0.1053 | No |
| 4 | DUSP5 | DUSP5 Entrez, Source | dual specificity phosphatase 5 | 2225 | 0.087 | -0.0148 | No |
| 5 | MBNL1 | MBNL1 Entrez, Source | muscleblind-like (Drosophila) | 2291 | 0.085 | -0.0059 | No |
| 6 | NPPA | NPPA Entrez, Source | natriuretic peptide precursor A | 3206 | 0.062 | -0.0645 | No |
| 7 | ATRX | ATRX Entrez, Source | alpha thalassemia/mental retardation syndrome X-linked (RAD54 homolog, S. cerevisiae) | 5030 | 0.029 | -0.1969 | No |
| 8 | NR4A1 | NR4A1 Entrez, Source | nuclear receptor subfamily 4, group A, member 1 | 5523 | 0.021 | -0.2305 | No |
| 9 | TCF4 | TCF4 Entrez, Source | transcription factor 4 | 5953 | 0.015 | -0.2603 | No |
| 10 | TRDN | TRDN Entrez, Source | triadin | 6145 | 0.012 | -0.2727 | No |
| 11 | FGFRL1 | FGFRL1 Entrez, Source | fibroblast growth factor receptor-like 1 | 6270 | 0.010 | -0.2804 | No |
| 12 | PLCB3 | PLCB3 Entrez, Source | phospholipase C, beta 3 (phosphatidylinositol-specific) | 6441 | 0.007 | -0.2920 | No |
| 13 | SCN3B | SCN3B Entrez, Source | sodium channel, voltage-gated, type III, beta | 6584 | 0.005 | -0.3018 | No |
| 14 | ANP32E | ANP32E Entrez, Source | acidic (leucine-rich) nuclear phosphoprotein 32 family, member E | 6623 | 0.005 | -0.3038 | No |
| 15 | NKX6-1 | NKX6-1 Entrez, Source | NK6 transcription factor related, locus 1 (Drosophila) | 6704 | 0.004 | -0.3092 | No |
| 16 | MYH11 | MYH11 Entrez, Source | myosin, heavy chain 11, smooth muscle | 6721 | 0.004 | -0.3098 | No |
| 17 | KCNK3 | KCNK3 Entrez, Source | potassium channel, subfamily K, member 3 | 6725 | 0.004 | -0.3095 | No |
| 18 | SFRS12 | SFRS12 Entrez, Source | splicing factor, arginine/serine-rich 12 | 7147 | -0.002 | -0.3408 | No |
| 19 | TNNC1 | TNNC1 Entrez, Source | troponin C type 1 (slow) | 7348 | -0.005 | -0.3550 | No |
| 20 | DUSP2 | DUSP2 Entrez, Source | dual specificity phosphatase 2 | 7577 | -0.009 | -0.3707 | No |
| 21 | CKM | CKM Entrez, Source | creatine kinase, muscle | 8557 | -0.024 | -0.4404 | No |
| 22 | EPHB1 | EPHB1 Entrez, Source | EPH receptor B1 | 8589 | -0.025 | -0.4387 | No |
| 23 | MRGPRF | MRGPRF Entrez, Source | MAS-related GPR, member F | 8754 | -0.027 | -0.4466 | No |
| 24 | PPP1R12A | PPP1R12A Entrez, Source | protein phosphatase 1, regulatory (inhibitor) subunit 12A | 8798 | -0.028 | -0.4453 | No |
| 25 | PHF12 | PHF12 Entrez, Source | PHD finger protein 12 | 9531 | -0.042 | -0.4935 | No |
| 26 | TITF1 | TITF1 Entrez, Source | thyroid transcription factor 1 | 10088 | -0.054 | -0.5265 | No |
| 27 | DAPK3 | DAPK3 Entrez, Source | death-associated protein kinase 3 | 10672 | -0.069 | -0.5592 | No |
| 28 | CSRP1 | CSRP1 Entrez, Source | cysteine and glycine-rich protein 1 | 11225 | -0.087 | -0.5866 | No |
| 29 | ACTG2 | ACTG2 Entrez, Source | actin, gamma 2, smooth muscle, enteric | 11475 | -0.099 | -0.5893 | Yes |
| 30 | ACTB | ACTB Entrez, Source | actin, beta | 11552 | -0.102 | -0.5785 | Yes |
| 31 | SDPR | SDPR Entrez, Source | serum deprivation response (phosphatidylserine binding protein) | 11603 | -0.105 | -0.5653 | Yes |
| 32 | DIXDC1 | DIXDC1 Entrez, Source | DIX domain containing 1 | 11625 | -0.106 | -0.5498 | Yes |
| 33 | MAPKAPK2 | MAPKAPK2 Entrez, Source | mitogen-activated protein kinase-activated protein kinase 2 | 11727 | -0.110 | -0.5395 | Yes |
| 34 | PFN1 | PFN1 Entrez, Source | profilin 1 | 11762 | -0.112 | -0.5239 | Yes |
| 35 | RAB30 | RAB30 Entrez, Source | RAB30, member RAS oncogene family | 12212 | -0.140 | -0.5348 | Yes |
| 36 | LSP1 | LSP1 Entrez, Source | lymphocyte-specific protein 1 | 12383 | -0.156 | -0.5223 | Yes |
| 37 | PICALM | PICALM Entrez, Source | phosphatidylinositol binding clathrin assembly protein | 12640 | -0.193 | -0.5103 | Yes |
| 38 | CALD1 | CALD1 Entrez, Source | caldesmon 1 | 12690 | -0.203 | -0.4810 | Yes |
| 39 | PLN | PLN Entrez, Source | phospholamban | 12709 | -0.206 | -0.4489 | Yes |
| 40 | TAGLN | TAGLN Entrez, Source | transgelin | 13339 | -1.475 | -0.2570 | Yes |
| 41 | ACTA1 | ACTA1 Entrez, Source | actin, alpha 1, skeletal muscle | 13340 | -1.586 | 0.0002 | Yes |