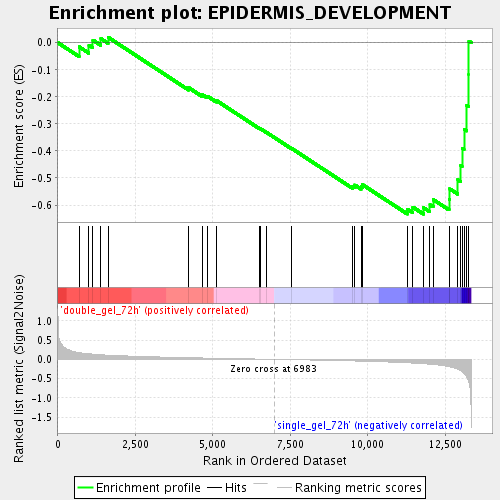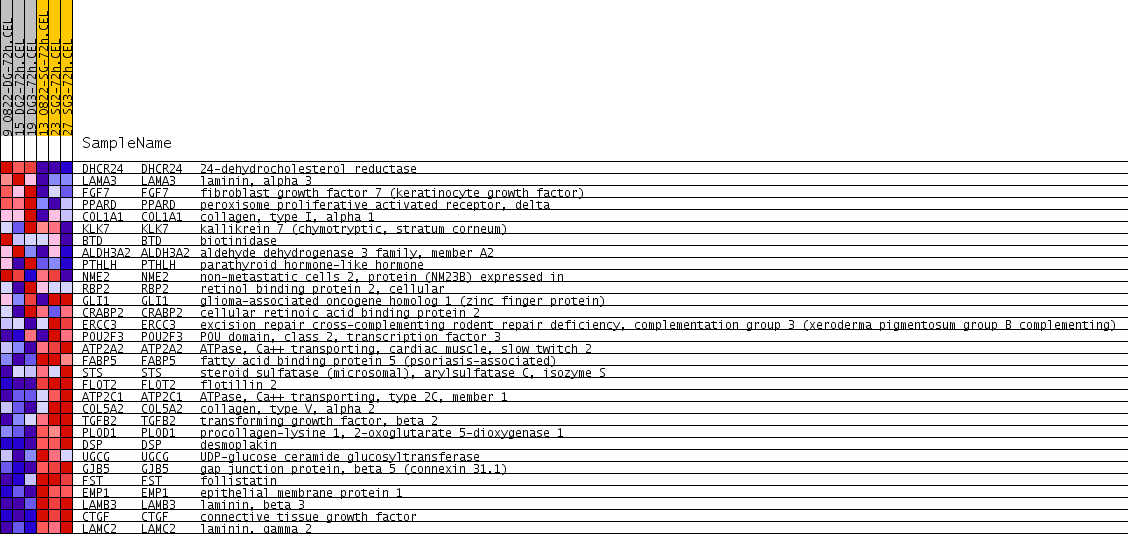
Profile of the Running ES Score & Positions of GeneSet Members on the Rank Ordered List
| Dataset | double_gel_and_single_gel_rma_expression_values_collapsed_to_symbols.class.cls #double_gel_72h_versus_single_gel_72h.class.cls #double_gel_72h_versus_single_gel_72h_repos |
| Phenotype | class.cls#double_gel_72h_versus_single_gel_72h_repos |
| Upregulated in class | single_gel_72h |
| GeneSet | EPIDERMIS_DEVELOPMENT |
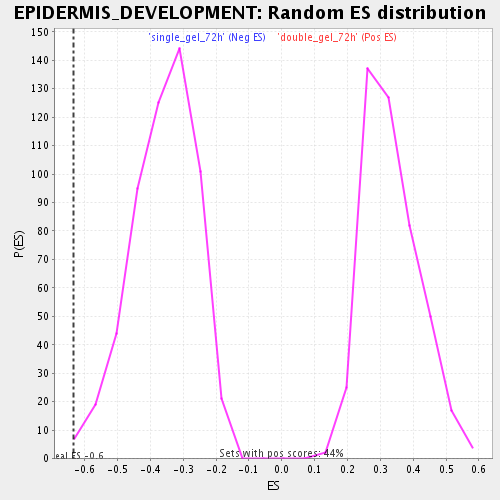
| Enrichment Score (ES) | -0.63352424 |
| Normalized Enrichment Score (NES) | -1.7659637 |
| Nominal p-value | 0.0053956835 |
| FDR q-value | 0.042659506 |
| FWER p-Value | 0.999 |

| PROBE | GENE SYMBOL | GENE_TITLE | RANK IN GENE LIST | RANK METRIC SCORE | RUNNING ES | CORE ENRICHMENT | |
|---|---|---|---|---|---|---|---|
| 1 | DHCR24 | DHCR24 Entrez, Source | 24-dehydrocholesterol reductase | 685 | 0.175 | -0.0151 | No |
| 2 | LAMA3 | LAMA3 Entrez, Source | laminin, alpha 3 | 1001 | 0.144 | -0.0088 | No |
| 3 | FGF7 | FGF7 Entrez, Source | fibroblast growth factor 7 (keratinocyte growth factor) | 1129 | 0.135 | 0.0097 | No |
| 4 | PPARD | PPARD Entrez, Source | peroxisome proliferative activated receptor, delta | 1387 | 0.119 | 0.0152 | No |
| 5 | COL1A1 | COL1A1 Entrez, Source | collagen, type I, alpha 1 | 1619 | 0.108 | 0.0203 | No |
| 6 | KLK7 | KLK7 Entrez, Source | kallikrein 7 (chymotryptic, stratum corneum) | 4220 | 0.043 | -0.1662 | No |
| 7 | BTD | BTD Entrez, Source | biotinidase | 4657 | 0.035 | -0.1917 | No |
| 8 | ALDH3A2 | ALDH3A2 Entrez, Source | aldehyde dehydrogenase 3 family, member A2 | 4819 | 0.032 | -0.1971 | No |
| 9 | PTHLH | PTHLH Entrez, Source | parathyroid hormone-like hormone | 5115 | 0.027 | -0.2136 | No |
| 10 | NME2 | NME2 Entrez, Source | non-metastatic cells 2, protein (NM23B) expressed in | 6499 | 0.006 | -0.3161 | No |
| 11 | RBP2 | RBP2 Entrez, Source | retinol binding protein 2, cellular | 6542 | 0.006 | -0.3181 | No |
| 12 | GLI1 | GLI1 Entrez, Source | glioma-associated oncogene homolog 1 (zinc finger protein) | 6743 | 0.003 | -0.3324 | No |
| 13 | CRABP2 | CRABP2 Entrez, Source | cellular retinoic acid binding protein 2 | 7542 | -0.008 | -0.3906 | No |
| 14 | ERCC3 | ERCC3 Entrez, Source | excision repair cross-complementing rodent repair deficiency, complementation group 3 (xeroderma pigmentosum group B complementing) | 9513 | -0.042 | -0.5299 | No |
| 15 | POU2F3 | POU2F3 Entrez, Source | POU domain, class 2, transcription factor 3 | 9580 | -0.043 | -0.5259 | No |
| 16 | ATP2A2 | ATP2A2 Entrez, Source | ATPase, Ca++ transporting, cardiac muscle, slow twitch 2 | 9784 | -0.048 | -0.5313 | No |
| 17 | FABP5 | FABP5 Entrez, Source | fatty acid binding protein 5 (psoriasis-associated) | 9829 | -0.048 | -0.5246 | No |
| 18 | STS | STS Entrez, Source | steroid sulfatase (microsomal), arylsulfatase C, isozyme S | 11277 | -0.089 | -0.6147 | Yes |
| 19 | FLOT2 | FLOT2 Entrez, Source | flotillin 2 | 11454 | -0.098 | -0.6077 | Yes |
| 20 | ATP2C1 | ATP2C1 Entrez, Source | ATPase, Ca++ transporting, type 2C, member 1 | 11799 | -0.114 | -0.6099 | Yes |
| 21 | COL5A2 | COL5A2 Entrez, Source | collagen, type V, alpha 2 | 12008 | -0.126 | -0.5995 | Yes |
| 22 | TGFB2 | TGFB2 Entrez, Source | transforming growth factor, beta 2 | 12112 | -0.132 | -0.5798 | Yes |
| 23 | PLOD1 | PLOD1 Entrez, Source | procollagen-lysine 1, 2-oxoglutarate 5-dioxygenase 1 | 12626 | -0.189 | -0.5791 | Yes |
| 24 | DSP | DSP Entrez, Source | desmoplakin | 12648 | -0.194 | -0.5404 | Yes |
| 25 | UGCG | UGCG Entrez, Source | UDP-glucose ceramide glucosyltransferase | 12906 | -0.254 | -0.5069 | Yes |
| 26 | GJB5 | GJB5 Entrez, Source | gap junction protein, beta 5 (connexin 31.1) | 13002 | -0.292 | -0.4534 | Yes |
| 27 | FST | FST Entrez, Source | follistatin | 13045 | -0.318 | -0.3906 | Yes |
| 28 | EMP1 | EMP1 Entrez, Source | epithelial membrane protein 1 | 13109 | -0.363 | -0.3200 | Yes |
| 29 | LAMB3 | LAMB3 Entrez, Source | laminin, beta 3 | 13195 | -0.458 | -0.2312 | Yes |
| 30 | CTGF | CTGF Entrez, Source | connective tissue growth factor | 13260 | -0.571 | -0.1173 | Yes |
| 31 | LAMC2 | LAMC2 Entrez, Source | laminin, gamma 2 | 13264 | -0.594 | 0.0059 | Yes |

