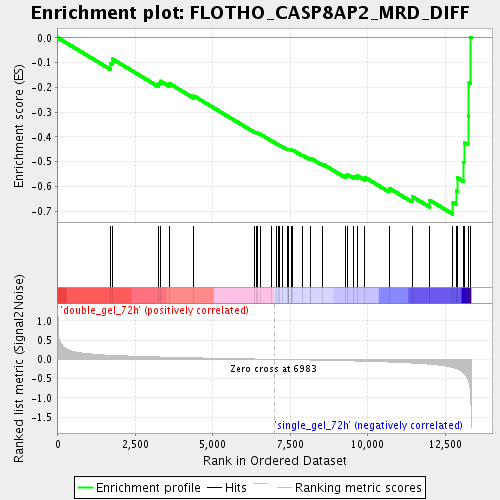
Profile of the Running ES Score & Positions of GeneSet Members on the Rank Ordered List
| Dataset | double_gel_and_single_gel_rma_expression_values_collapsed_to_symbols.class.cls #double_gel_72h_versus_single_gel_72h.class.cls #double_gel_72h_versus_single_gel_72h_repos |
| Phenotype | class.cls#double_gel_72h_versus_single_gel_72h_repos |
| Upregulated in class | single_gel_72h |
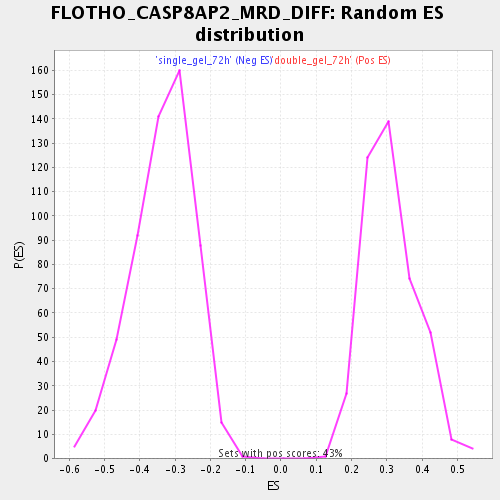
| GeneSet | FLOTHO_CASP8AP2_MRD_DIFF |
| Enrichment Score (ES) | -0.7114124 |
| Normalized Enrichment Score (NES) | -2.1207817 |
| Nominal p-value | 0.0 |
| FDR q-value | 0.0011573271 |
| FWER p-Value | 0.014 |
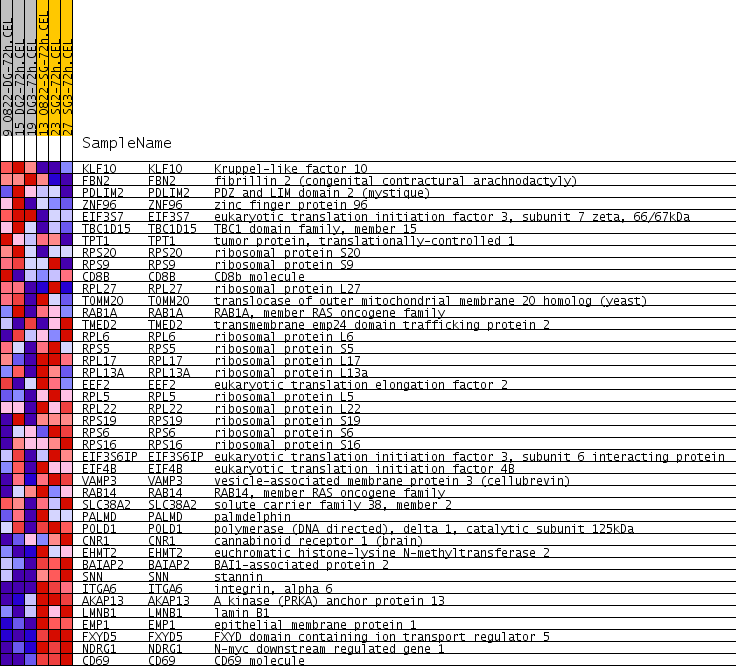
| PROBE | GENE SYMBOL | GENE_TITLE | RANK IN GENE LIST | RANK METRIC SCORE | RUNNING ES | CORE ENRICHMENT | |
|---|---|---|---|---|---|---|---|
| 1 | KLF10 | KLF10 Entrez, Source | Kruppel-like factor 10 | 1693 | 0.105 | -0.1037 | No |
| 2 | FBN2 | FBN2 Entrez, Source | fibrillin 2 (congenital contractural arachnodactyly) | 1754 | 0.103 | -0.0851 | No |
| 3 | PDLIM2 | PDLIM2 Entrez, Source | PDZ and LIM domain 2 (mystique) | 3251 | 0.061 | -0.1839 | No |
| 4 | ZNF96 | ZNF96 Entrez, Source | zinc finger protein 96 | 3302 | 0.060 | -0.1742 | No |
| 5 | EIF3S7 | EIF3S7 Entrez, Source | eukaryotic translation initiation factor 3, subunit 7 zeta, 66/67kDa | 3589 | 0.054 | -0.1836 | No |
| 6 | TBC1D15 | TBC1D15 Entrez, Source | TBC1 domain family, member 15 | 4388 | 0.040 | -0.2346 | No |
| 7 | TPT1 | TPT1 Entrez, Source | tumor protein, translationally-controlled 1 | 6352 | 0.009 | -0.3803 | No |
| 8 | RPS20 | RPS20 Entrez, Source | ribosomal protein S20 | 6408 | 0.008 | -0.3827 | No |
| 9 | RPS9 | RPS9 Entrez, Source | ribosomal protein S9 | 6448 | 0.007 | -0.3840 | No |
| 10 | CD8B | CD8B Entrez, Source | CD8b molecule | 6543 | 0.006 | -0.3898 | No |
| 11 | RPL27 | RPL27 Entrez, Source | ribosomal protein L27 | 6890 | 0.001 | -0.4155 | No |
| 12 | TOMM20 | TOMM20 Entrez, Source | translocase of outer mitochondrial membrane 20 homolog (yeast) | 7046 | -0.001 | -0.4269 | No |
| 13 | RAB1A | RAB1A Entrez, Source | RAB1A, member RAS oncogene family | 7133 | -0.002 | -0.4329 | No |
| 14 | TMED2 | TMED2 Entrez, Source | transmembrane emp24 domain trafficking protein 2 | 7149 | -0.002 | -0.4334 | No |
| 15 | RPL6 | RPL6 Entrez, Source | ribosomal protein L6 | 7233 | -0.003 | -0.4389 | No |
| 16 | RPS5 | RPS5 Entrez, Source | ribosomal protein S5 | 7405 | -0.006 | -0.4504 | No |
| 17 | RPL17 | RPL17 Entrez, Source | ribosomal protein L17 | 7426 | -0.006 | -0.4505 | No |
| 18 | RPL13A | RPL13A Entrez, Source | ribosomal protein L13a | 7446 | -0.007 | -0.4504 | No |
| 19 | EEF2 | EEF2 Entrez, Source | eukaryotic translation elongation factor 2 | 7448 | -0.007 | -0.4490 | No |
| 20 | RPL5 | RPL5 Entrez, Source | ribosomal protein L5 | 7524 | -0.008 | -0.4529 | No |
| 21 | RPL22 | RPL22 Entrez, Source | ribosomal protein L22 | 7541 | -0.008 | -0.4523 | No |
| 22 | RPS19 | RPS19 Entrez, Source | ribosomal protein S19 | 7575 | -0.009 | -0.4528 | No |
| 23 | RPS6 | RPS6 Entrez, Source | ribosomal protein S6 | 7886 | -0.013 | -0.4731 | No |
| 24 | RPS16 | RPS16 Entrez, Source | ribosomal protein S16 | 8144 | -0.017 | -0.4886 | No |
| 25 | EIF3S6IP | EIF3S6IP Entrez, Source | eukaryotic translation initiation factor 3, subunit 6 interacting protein | 8151 | -0.017 | -0.4852 | No |
| 26 | EIF4B | EIF4B Entrez, Source | eukaryotic translation initiation factor 4B | 8550 | -0.024 | -0.5098 | No |
| 27 | VAMP3 | VAMP3 Entrez, Source | vesicle-associated membrane protein 3 (cellubrevin) | 9280 | -0.037 | -0.5562 | No |
| 28 | RAB14 | RAB14 Entrez, Source | RAB14, member RAS oncogene family | 9351 | -0.039 | -0.5528 | No |
| 29 | SLC38A2 | SLC38A2 Entrez, Source | solute carrier family 38, member 2 | 9549 | -0.043 | -0.5580 | No |
| 30 | PALMD | PALMD Entrez, Source | palmdelphin | 9671 | -0.045 | -0.5570 | No |
| 31 | POLD1 | POLD1 Entrez, Source | polymerase (DNA directed), delta 1, catalytic subunit 125kDa | 9909 | -0.050 | -0.5636 | No |
| 32 | CNR1 | CNR1 Entrez, Source | cannabinoid receptor 1 (brain) | 10688 | -0.069 | -0.6065 | No |
| 33 | EHMT2 | EHMT2 Entrez, Source | euchromatic histone-lysine N-methyltransferase 2 | 11435 | -0.097 | -0.6409 | No |
| 34 | BAIAP2 | BAIAP2 Entrez, Source | BAI1-associated protein 2 | 11997 | -0.125 | -0.6551 | No |
| 35 | SNN | SNN Entrez, Source | stannin | 12747 | -0.213 | -0.6636 | Yes |
| 36 | ITGA6 | ITGA6 Entrez, Source | integrin, alpha 6 | 12855 | -0.239 | -0.6180 | Yes |
| 37 | AKAP13 | AKAP13 Entrez, Source | A kinase (PRKA) anchor protein 13 | 12887 | -0.247 | -0.5649 | Yes |
| 38 | LMNB1 | LMNB1 Entrez, Source | lamin B1 | 13086 | -0.343 | -0.5028 | Yes |
| 39 | EMP1 | EMP1 Entrez, Source | epithelial membrane protein 1 | 13109 | -0.363 | -0.4230 | Yes |
| 40 | FXYD5 | FXYD5 Entrez, Source | FXYD domain containing ion transport regulator 5 | 13236 | -0.522 | -0.3154 | Yes |
| 41 | NDRG1 | NDRG1 Entrez, Source | N-myc downstream regulated gene 1 | 13266 | -0.607 | -0.1813 | Yes |
| 42 | CD69 | CD69 Entrez, Source | CD69 molecule | 13310 | -0.833 | 0.0024 | Yes |