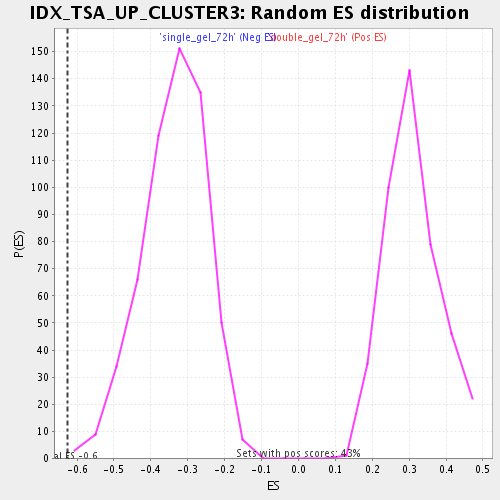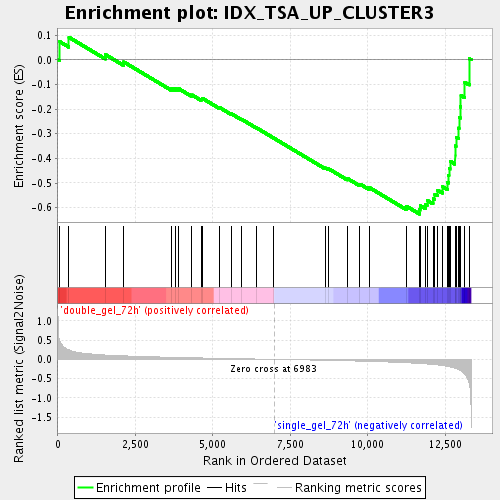
Profile of the Running ES Score & Positions of GeneSet Members on the Rank Ordered List
| Dataset | double_gel_and_single_gel_rma_expression_values_collapsed_to_symbols.class.cls #double_gel_72h_versus_single_gel_72h.class.cls #double_gel_72h_versus_single_gel_72h_repos |
| Phenotype | class.cls#double_gel_72h_versus_single_gel_72h_repos |
| Upregulated in class | single_gel_72h |
| GeneSet | IDX_TSA_UP_CLUSTER3 |
| Enrichment Score (ES) | -0.6262245 |
| Normalized Enrichment Score (NES) | -1.8564909 |
| Nominal p-value | 0.0017421603 |
| FDR q-value | 0.028718462 |
| FWER p-Value | 0.783 |
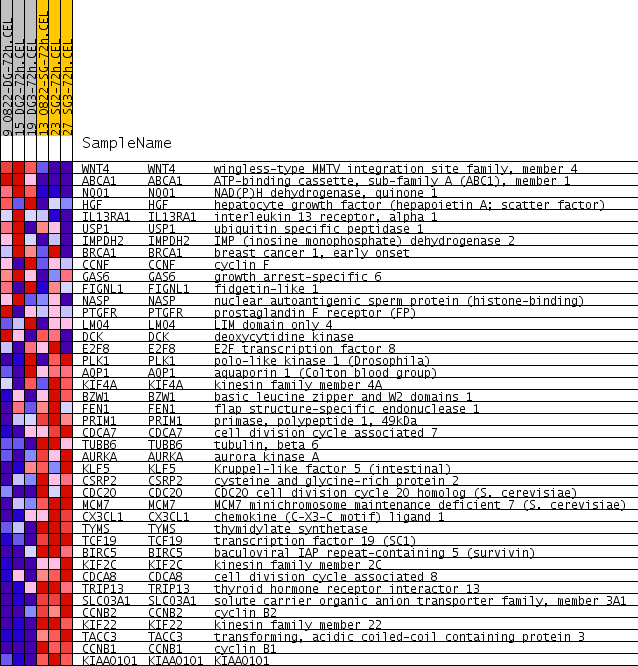
| PROBE | GENE SYMBOL | GENE_TITLE | RANK IN GENE LIST | RANK METRIC SCORE | RUNNING ES | CORE ENRICHMENT | |
|---|---|---|---|---|---|---|---|
| 1 | WNT4 | WNT4 Entrez, Source | wingless-type MMTV integration site family, member 4 | 59 | 0.482 | 0.0737 | No |
| 2 | ABCA1 | ABCA1 Entrez, Source | ATP-binding cassette, sub-family A (ABC1), member 1 | 355 | 0.248 | 0.0917 | No |
| 3 | NQO1 | NQO1 Entrez, Source | NAD(P)H dehydrogenase, quinone 1 | 1532 | 0.112 | 0.0214 | No |
| 4 | HGF | HGF Entrez, Source | hepatocyte growth factor (hepapoietin A; scatter factor) | 2125 | 0.090 | -0.0085 | No |
| 5 | IL13RA1 | IL13RA1 Entrez, Source | interleukin 13 receptor, alpha 1 | 3674 | 0.052 | -0.1164 | No |
| 6 | USP1 | USP1 Entrez, Source | ubiquitin specific peptidase 1 | 3790 | 0.050 | -0.1169 | No |
| 7 | IMPDH2 | IMPDH2 Entrez, Source | IMP (inosine monophosphate) dehydrogenase 2 | 3898 | 0.048 | -0.1171 | No |
| 8 | BRCA1 | BRCA1 Entrez, Source | breast cancer 1, early onset | 4326 | 0.041 | -0.1426 | No |
| 9 | CCNF | CCNF Entrez, Source | cyclin F | 4623 | 0.036 | -0.1591 | No |
| 10 | GAS6 | GAS6 Entrez, Source | growth arrest-specific 6 | 4656 | 0.035 | -0.1558 | No |
| 11 | FIGNL1 | FIGNL1 Entrez, Source | fidgetin-like 1 | 5215 | 0.026 | -0.1935 | No |
| 12 | NASP | NASP Entrez, Source | nuclear autoantigenic sperm protein (histone-binding) | 5597 | 0.020 | -0.2189 | No |
| 13 | PTGFR | PTGFR Entrez, Source | prostaglandin F receptor (FP) | 5917 | 0.015 | -0.2404 | No |
| 14 | LMO4 | LMO4 Entrez, Source | LIM domain only 4 | 6402 | 0.008 | -0.2755 | No |
| 15 | DCK | DCK Entrez, Source | deoxycytidine kinase | 6967 | 0.000 | -0.3179 | No |
| 16 | E2F8 | E2F8 Entrez, Source | E2F transcription factor 8 | 8633 | -0.025 | -0.4389 | No |
| 17 | PLK1 | PLK1 Entrez, Source | polo-like kinase 1 (Drosophila) | 8736 | -0.027 | -0.4422 | No |
| 18 | AQP1 | AQP1 Entrez, Source | aquaporin 1 (Colton blood group) | 9344 | -0.039 | -0.4816 | No |
| 19 | KIF4A | KIF4A Entrez, Source | kinesin family member 4A | 9748 | -0.047 | -0.5043 | No |
| 20 | BZW1 | BZW1 Entrez, Source | basic leucine zipper and W2 domains 1 | 10041 | -0.053 | -0.5177 | No |
| 21 | FEN1 | FEN1 Entrez, Source | flap structure-specific endonuclease 1 | 11249 | -0.088 | -0.5942 | No |
| 22 | PRIM1 | PRIM1 Entrez, Source | primase, polypeptide 1, 49kDa | 11676 | -0.108 | -0.6087 | Yes |
| 23 | CDCA7 | CDCA7 Entrez, Source | cell division cycle associated 7 | 11689 | -0.109 | -0.5920 | Yes |
| 24 | TUBB6 | TUBB6 Entrez, Source | tubulin, beta 6 | 11867 | -0.117 | -0.5863 | Yes |
| 25 | AURKA | AURKA Entrez, Source | aurora kinase A | 11917 | -0.119 | -0.5706 | Yes |
| 26 | KLF5 | KLF5 Entrez, Source | Kruppel-like factor 5 (intestinal) | 12107 | -0.132 | -0.5635 | Yes |
| 27 | CSRP2 | CSRP2 Entrez, Source | cysteine and glycine-rich protein 2 | 12164 | -0.135 | -0.5458 | Yes |
| 28 | CDC20 | CDC20 Entrez, Source | CDC20 cell division cycle 20 homolog (S. cerevisiae) | 12256 | -0.144 | -0.5292 | Yes |
| 29 | MCM7 | MCM7 Entrez, Source | MCM7 minichromosome maintenance deficient 7 (S. cerevisiae) | 12413 | -0.160 | -0.5151 | Yes |
| 30 | CX3CL1 | CX3CL1 Entrez, Source | chemokine (C-X3-C motif) ligand 1 | 12570 | -0.180 | -0.4976 | Yes |
| 31 | TYMS | TYMS Entrez, Source | thymidylate synthetase | 12607 | -0.185 | -0.4702 | Yes |
| 32 | TCF19 | TCF19 Entrez, Source | transcription factor 19 (SC1) | 12623 | -0.188 | -0.4408 | Yes |
| 33 | BIRC5 | BIRC5 Entrez, Source | baculoviral IAP repeat-containing 5 (survivin) | 12656 | -0.196 | -0.4115 | Yes |
| 34 | KIF2C | KIF2C Entrez, Source | kinesin family member 2C | 12815 | -0.228 | -0.3863 | Yes |
| 35 | CDCA8 | CDCA8 Entrez, Source | cell division cycle associated 8 | 12816 | -0.228 | -0.3493 | Yes |
| 36 | TRIP13 | TRIP13 Entrez, Source | thyroid hormone receptor interactor 13 | 12851 | -0.238 | -0.3133 | Yes |
| 37 | SLCO3A1 | SLCO3A1 Entrez, Source | solute carrier organic anion transporter family, member 3A1 | 12932 | -0.263 | -0.2767 | Yes |
| 38 | CCNB2 | CCNB2 Entrez, Source | cyclin B2 | 12949 | -0.272 | -0.2338 | Yes |
| 39 | KIF22 | KIF22 Entrez, Source | kinesin family member 22 | 12985 | -0.285 | -0.1903 | Yes |
| 40 | TACC3 | TACC3 Entrez, Source | transforming, acidic coiled-coil containing protein 3 | 13008 | -0.294 | -0.1443 | Yes |
| 41 | CCNB1 | CCNB1 Entrez, Source | cyclin B1 | 13131 | -0.385 | -0.0911 | Yes |
| 42 | KIAA0101 | KIAA0101 Entrez, Source | KIAA0101 | 13280 | -0.659 | 0.0047 | Yes |