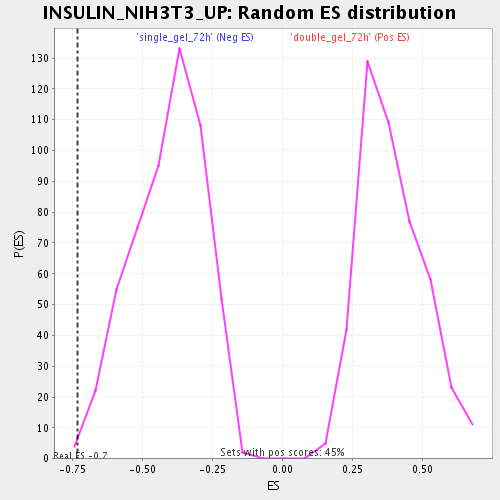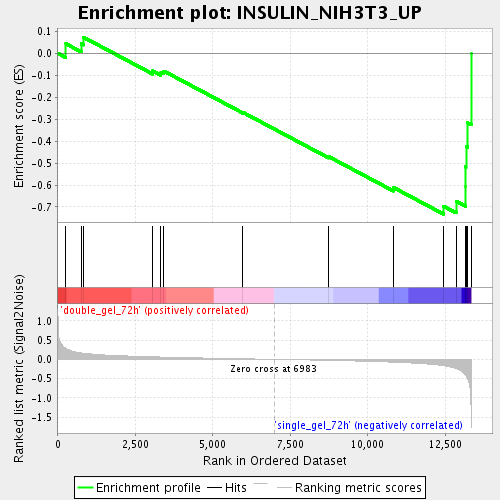
Profile of the Running ES Score & Positions of GeneSet Members on the Rank Ordered List
| Dataset | double_gel_and_single_gel_rma_expression_values_collapsed_to_symbols.class.cls #double_gel_72h_versus_single_gel_72h.class.cls #double_gel_72h_versus_single_gel_72h_repos |
| Phenotype | class.cls#double_gel_72h_versus_single_gel_72h_repos |
| Upregulated in class | single_gel_72h |
| GeneSet | INSULIN_NIH3T3_UP |
| Enrichment Score (ES) | -0.732533 |
| Normalized Enrichment Score (NES) | -1.7909842 |
| Nominal p-value | 0.0018315018 |
| FDR q-value | 0.03913131 |
| FWER p-Value | 0.984 |
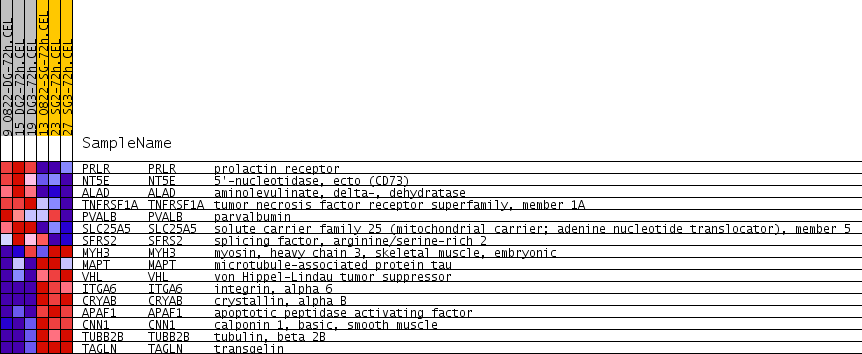
| PROBE | GENE SYMBOL | GENE_TITLE | RANK IN GENE LIST | RANK METRIC SCORE | RUNNING ES | CORE ENRICHMENT | |
|---|---|---|---|---|---|---|---|
| 1 | PRLR | PRLR Entrez, Source | prolactin receptor | 257 | 0.285 | 0.0437 | No |
| 2 | NT5E | NT5E Entrez, Source | 5'-nucleotidase, ecto (CD73) | 752 | 0.167 | 0.0435 | No |
| 3 | ALAD | ALAD Entrez, Source | aminolevulinate, delta-, dehydratase | 826 | 0.160 | 0.0733 | No |
| 4 | TNFRSF1A | TNFRSF1A Entrez, Source | tumor necrosis factor receptor superfamily, member 1A | 3063 | 0.065 | -0.0801 | No |
| 5 | PVALB | PVALB Entrez, Source | parvalbumin | 3324 | 0.059 | -0.0865 | No |
| 6 | SLC25A5 | SLC25A5 Entrez, Source | solute carrier family 25 (mitochondrial carrier; adenine nucleotide translocator), member 5 | 3418 | 0.058 | -0.0808 | No |
| 7 | SFRS2 | SFRS2 Entrez, Source | splicing factor, arginine/serine-rich 2 | 5972 | 0.015 | -0.2691 | No |
| 8 | MYH3 | MYH3 Entrez, Source | myosin, heavy chain 3, skeletal muscle, embryonic | 8743 | -0.027 | -0.4710 | No |
| 9 | MAPT | MAPT Entrez, Source | microtubule-associated protein tau | 10830 | -0.073 | -0.6114 | No |
| 10 | VHL | VHL Entrez, Source | von Hippel-Lindau tumor suppressor | 12446 | -0.164 | -0.6964 | Yes |
| 11 | ITGA6 | ITGA6 Entrez, Source | integrin, alpha 6 | 12855 | -0.239 | -0.6743 | Yes |
| 12 | CRYAB | CRYAB Entrez, Source | crystallin, alpha B | 13153 | -0.404 | -0.6076 | Yes |
| 13 | APAF1 | APAF1 Entrez, Source | apoptotic peptidase activating factor | 13156 | -0.411 | -0.5171 | Yes |
| 14 | CNN1 | CNN1 Entrez, Source | calponin 1, basic, smooth muscle | 13171 | -0.429 | -0.4235 | Yes |
| 15 | TUBB2B | TUBB2B Entrez, Source | tubulin, beta 2B | 13224 | -0.502 | -0.3166 | Yes |
| 16 | TAGLN | TAGLN Entrez, Source | transgelin | 13339 | -1.475 | 0.0002 | Yes |