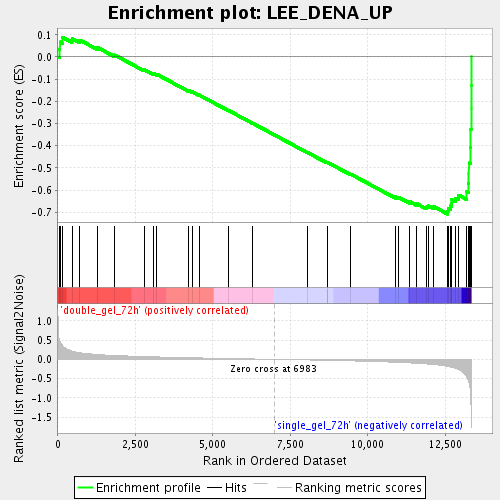
Profile of the Running ES Score & Positions of GeneSet Members on the Rank Ordered List
| Dataset | double_gel_and_single_gel_rma_expression_values_collapsed_to_symbols.class.cls #double_gel_72h_versus_single_gel_72h.class.cls #double_gel_72h_versus_single_gel_72h_repos |
| Phenotype | class.cls#double_gel_72h_versus_single_gel_72h_repos |
| Upregulated in class | single_gel_72h |
| GeneSet | LEE_DENA_UP |
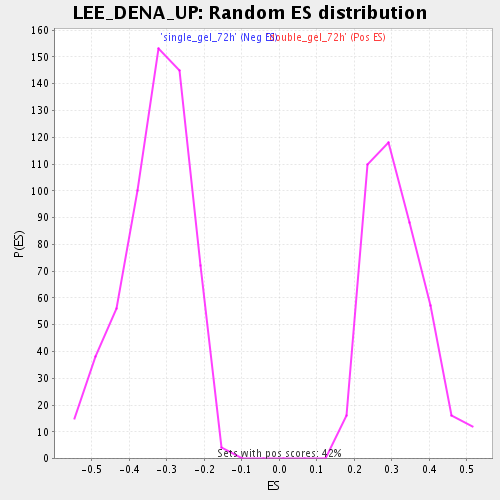
| Enrichment Score (ES) | -0.70837194 |
| Normalized Enrichment Score (NES) | -2.1401448 |
| Nominal p-value | 0.0 |
| FDR q-value | 0.0012402372 |
| FWER p-Value | 0.011 |
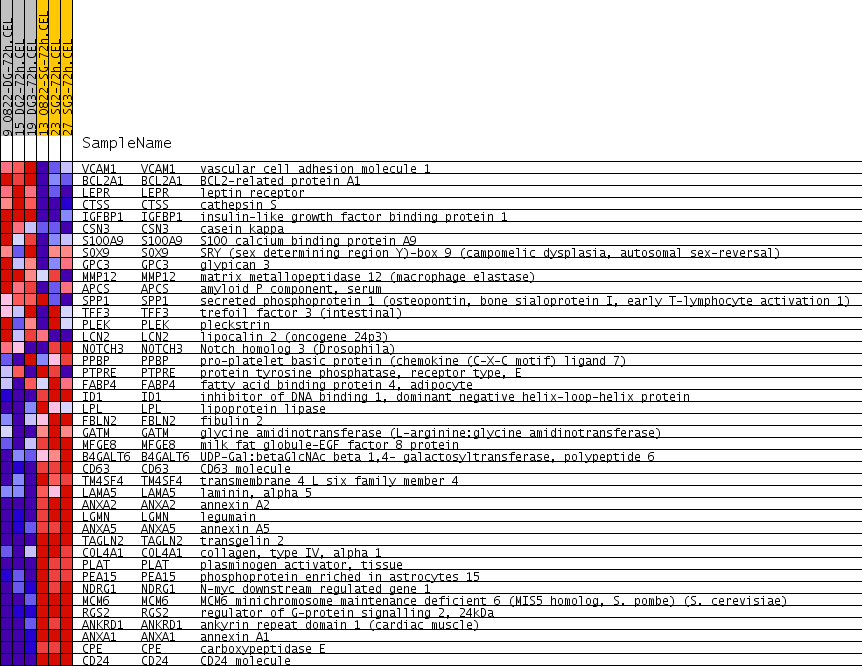
| PROBE | GENE SYMBOL | GENE_TITLE | RANK IN GENE LIST | RANK METRIC SCORE | RUNNING ES | CORE ENRICHMENT | |
|---|---|---|---|---|---|---|---|
| 1 | VCAM1 | VCAM1 Entrez, Source | vascular cell adhesion molecule 1 | 49 | 0.501 | 0.0342 | No |
| 2 | BCL2A1 | BCL2A1 Entrez, Source | BCL2-related protein A1 | 67 | 0.459 | 0.0677 | No |
| 3 | LEPR | LEPR Entrez, Source | leptin receptor | 146 | 0.357 | 0.0889 | No |
| 4 | CTSS | CTSS Entrez, Source | cathepsin S | 456 | 0.214 | 0.0819 | No |
| 5 | IGFBP1 | IGFBP1 Entrez, Source | insulin-like growth factor binding protein 1 | 703 | 0.173 | 0.0764 | No |
| 6 | CSN3 | CSN3 Entrez, Source | casein kappa | 1273 | 0.126 | 0.0432 | No |
| 7 | S100A9 | S100A9 Entrez, Source | S100 calcium binding protein A9 | 1830 | 0.100 | 0.0090 | No |
| 8 | SOX9 | SOX9 Entrez, Source | SRY (sex determining region Y)-box 9 (campomelic dysplasia, autosomal sex-reversal) | 2781 | 0.072 | -0.0570 | No |
| 9 | GPC3 | GPC3 Entrez, Source | glypican 3 | 3083 | 0.065 | -0.0747 | No |
| 10 | MMP12 | MMP12 Entrez, Source | matrix metallopeptidase 12 (macrophage elastase) | 3186 | 0.063 | -0.0777 | No |
| 11 | APCS | APCS Entrez, Source | amyloid P component, serum | 4201 | 0.043 | -0.1507 | No |
| 12 | SPP1 | SPP1 Entrez, Source | secreted phosphoprotein 1 (osteopontin, bone sialoprotein I, early T-lymphocyte activation 1) | 4327 | 0.041 | -0.1570 | No |
| 13 | TFF3 | TFF3 Entrez, Source | trefoil factor 3 (intestinal) | 4555 | 0.037 | -0.1712 | No |
| 14 | PLEK | PLEK Entrez, Source | pleckstrin | 5509 | 0.022 | -0.2413 | No |
| 15 | LCN2 | LCN2 Entrez, Source | lipocalin 2 (oncogene 24p3) | 6284 | 0.010 | -0.2987 | No |
| 16 | NOTCH3 | NOTCH3 Entrez, Source | Notch homolog 3 (Drosophila) | 8065 | -0.016 | -0.4313 | No |
| 17 | PPBP | PPBP Entrez, Source | pro-platelet basic protein (chemokine (C-X-C motif) ligand 7) | 8685 | -0.026 | -0.4759 | No |
| 18 | PTPRE | PTPRE Entrez, Source | protein tyrosine phosphatase, receptor type, E | 8704 | -0.026 | -0.4752 | No |
| 19 | FABP4 | FABP4 Entrez, Source | fatty acid binding protein 4, adipocyte | 9450 | -0.041 | -0.5282 | No |
| 20 | ID1 | ID1 Entrez, Source | inhibitor of DNA binding 1, dominant negative helix-loop-helix protein | 10891 | -0.075 | -0.6308 | No |
| 21 | LPL | LPL Entrez, Source | lipoprotein lipase | 10988 | -0.078 | -0.6321 | No |
| 22 | FBLN2 | FBLN2 Entrez, Source | fibulin 2 | 11361 | -0.093 | -0.6530 | No |
| 23 | GATM | GATM Entrez, Source | glycine amidinotransferase (L-arginine:glycine amidinotransferase) | 11580 | -0.103 | -0.6615 | No |
| 24 | MFGE8 | MFGE8 Entrez, Source | milk fat globule-EGF factor 8 protein | 11896 | -0.118 | -0.6763 | No |
| 25 | B4GALT6 | B4GALT6 Entrez, Source | UDP-Gal:betaGlcNAc beta 1,4- galactosyltransferase, polypeptide 6 | 11958 | -0.122 | -0.6716 | No |
| 26 | CD63 | CD63 Entrez, Source | CD63 molecule | 12132 | -0.133 | -0.6745 | No |
| 27 | TM4SF4 | TM4SF4 Entrez, Source | transmembrane 4 L six family member 4 | 12583 | -0.182 | -0.6946 | Yes |
| 28 | LAMA5 | LAMA5 Entrez, Source | laminin, alpha 5 | 12592 | -0.184 | -0.6813 | Yes |
| 29 | ANXA2 | ANXA2 Entrez, Source | annexin A2 | 12661 | -0.197 | -0.6716 | Yes |
| 30 | LGMN | LGMN Entrez, Source | legumain | 12698 | -0.205 | -0.6588 | Yes |
| 31 | ANXA5 | ANXA5 Entrez, Source | annexin A5 | 12706 | -0.206 | -0.6437 | Yes |
| 32 | TAGLN2 | TAGLN2 Entrez, Source | transgelin 2 | 12837 | -0.233 | -0.6358 | Yes |
| 33 | COL4A1 | COL4A1 Entrez, Source | collagen, type IV, alpha 1 | 12937 | -0.264 | -0.6232 | Yes |
| 34 | PLAT | PLAT Entrez, Source | plasminogen activator, tissue | 13198 | -0.463 | -0.6077 | Yes |
| 35 | PEA15 | PEA15 Entrez, Source | phosphoprotein enriched in astrocytes 15 | 13253 | -0.561 | -0.5693 | Yes |
| 36 | NDRG1 | NDRG1 Entrez, Source | N-myc downstream regulated gene 1 | 13266 | -0.607 | -0.5243 | Yes |
| 37 | MCM6 | MCM6 Entrez, Source | MCM6 minichromosome maintenance deficient 6 (MIS5 homolog, S. pombe) (S. cerevisiae) | 13267 | -0.614 | -0.4778 | Yes |
| 38 | RGS2 | RGS2 Entrez, Source | regulator of G-protein signalling 2, 24kDa | 13321 | -0.988 | -0.4070 | Yes |
| 39 | ANKRD1 | ANKRD1 Entrez, Source | ankyrin repeat domain 1 (cardiac muscle) | 13328 | -1.067 | -0.3266 | Yes |
| 40 | ANXA1 | ANXA1 Entrez, Source | annexin A1 | 13336 | -1.272 | -0.2309 | Yes |
| 41 | CPE | CPE Entrez, Source | carboxypeptidase E | 13337 | -1.377 | -0.1266 | Yes |
| 42 | CD24 | CD24 Entrez, Source | CD24 molecule | 13341 | -1.675 | 0.0001 | Yes |