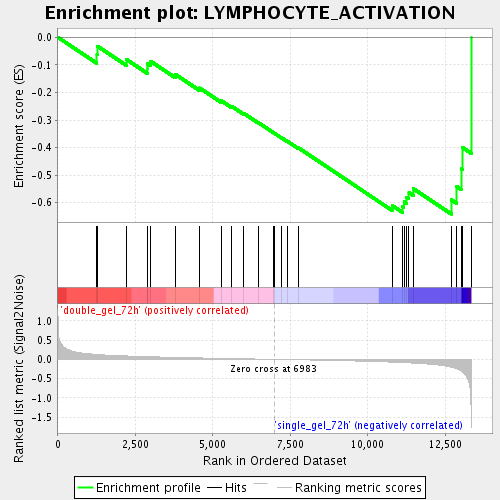
Profile of the Running ES Score & Positions of GeneSet Members on the Rank Ordered List
| Dataset | double_gel_and_single_gel_rma_expression_values_collapsed_to_symbols.class.cls #double_gel_72h_versus_single_gel_72h.class.cls #double_gel_72h_versus_single_gel_72h_repos |
| Phenotype | class.cls#double_gel_72h_versus_single_gel_72h_repos |
| Upregulated in class | single_gel_72h |
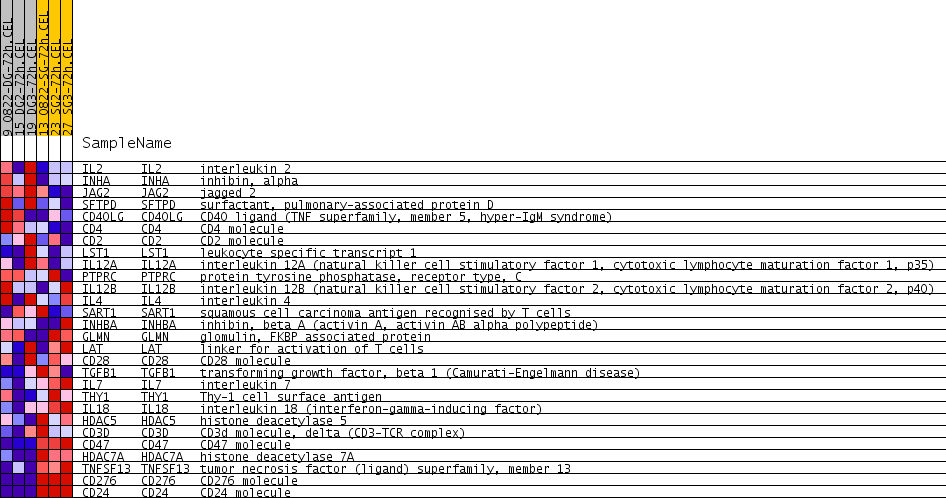
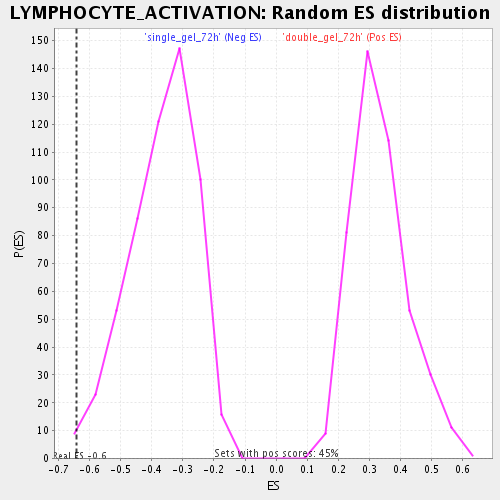
| GeneSet | LYMPHOCYTE_ACTIVATION |
| Enrichment Score (ES) | -0.64118433 |
| Normalized Enrichment Score (NES) | -1.7516338 |
| Nominal p-value | 0.0036036037 |
| FDR q-value | 0.04681689 |
| FWER p-Value | 0.999 |
| PROBE | GENE SYMBOL | GENE_TITLE | RANK IN GENE LIST | RANK METRIC SCORE | RUNNING ES | CORE ENRICHMENT | |
|---|---|---|---|---|---|---|---|
| 1 | IL2 | IL2 Entrez, Source | interleukin 2 | 1260 | 0.126 | -0.0629 | No |
| 2 | INHA | INHA Entrez, Source | inhibin, alpha | 1270 | 0.126 | -0.0319 | No |
| 3 | JAG2 | JAG2 Entrez, Source | jagged 2 | 2207 | 0.088 | -0.0801 | No |
| 4 | SFTPD | SFTPD Entrez, Source | surfactant, pulmonary-associated protein D | 2883 | 0.069 | -0.1134 | No |
| 5 | CD40LG | CD40LG Entrez, Source | CD40 ligand (TNF superfamily, member 5, hyper-IgM syndrome) | 2885 | 0.069 | -0.0960 | No |
| 6 | CD4 | CD4 Entrez, Source | CD4 molecule | 2984 | 0.067 | -0.0866 | No |
| 7 | CD2 | CD2 Entrez, Source | CD2 molecule | 3794 | 0.050 | -0.1348 | No |
| 8 | LST1 | LST1 Entrez, Source | leukocyte specific transcript 1 | 4571 | 0.037 | -0.1838 | No |
| 9 | IL12A | IL12A Entrez, Source | interleukin 12A (natural killer cell stimulatory factor 1, cytotoxic lymphocyte maturation factor 1, p35) | 5271 | 0.025 | -0.2300 | No |
| 10 | PTPRC | PTPRC Entrez, Source | protein tyrosine phosphatase, receptor type, C | 5608 | 0.020 | -0.2502 | No |
| 11 | IL12B | IL12B Entrez, Source | interleukin 12B (natural killer cell stimulatory factor 2, cytotoxic lymphocyte maturation factor 2, p40) | 6003 | 0.014 | -0.2762 | No |
| 12 | IL4 | IL4 Entrez, Source | interleukin 4 | 6466 | 0.007 | -0.3092 | No |
| 13 | SART1 | SART1 Entrez, Source | squamous cell carcinoma antigen recognised by T cells | 6969 | 0.000 | -0.3469 | No |
| 14 | INHBA | INHBA Entrez, Source | inhibin, beta A (activin A, activin AB alpha polypeptide) | 6984 | -0.000 | -0.3479 | No |
| 15 | GLMN | GLMN Entrez, Source | glomulin, FKBP associated protein | 7210 | -0.003 | -0.3640 | No |
| 16 | LAT | LAT Entrez, Source | linker for activation of T cells | 7393 | -0.006 | -0.3762 | No |
| 17 | CD28 | CD28 Entrez, Source | CD28 molecule | 7763 | -0.011 | -0.4010 | No |
| 18 | TGFB1 | TGFB1 Entrez, Source | transforming growth factor, beta 1 (Camurati-Engelmann disease) | 10788 | -0.072 | -0.6100 | No |
| 19 | IL7 | IL7 Entrez, Source | interleukin 7 | 11123 | -0.083 | -0.6143 | Yes |
| 20 | THY1 | THY1 Entrez, Source | Thy-1 cell surface antigen | 11169 | -0.084 | -0.5964 | Yes |
| 21 | IL18 | IL18 Entrez, Source | interleukin 18 (interferon-gamma-inducing factor) | 11246 | -0.088 | -0.5801 | Yes |
| 22 | HDAC5 | HDAC5 Entrez, Source | histone deacetylase 5 | 11330 | -0.092 | -0.5632 | Yes |
| 23 | CD3D | CD3D Entrez, Source | CD3d molecule, delta (CD3-TCR complex) | 11471 | -0.098 | -0.5490 | Yes |
| 24 | CD47 | CD47 Entrez, Source | CD47 molecule | 12700 | -0.205 | -0.5897 | Yes |
| 25 | HDAC7A | HDAC7A Entrez, Source | histone deacetylase 7A | 12873 | -0.243 | -0.5415 | Yes |
| 26 | TNFSF13 | TNFSF13 Entrez, Source | tumor necrosis factor (ligand) superfamily, member 13 | 13014 | -0.298 | -0.4771 | Yes |
| 27 | CD276 | CD276 Entrez, Source | CD276 molecule | 13052 | -0.320 | -0.3994 | Yes |
| 28 | CD24 | CD24 Entrez, Source | CD24 molecule | 13341 | -1.675 | 0.0001 | Yes |