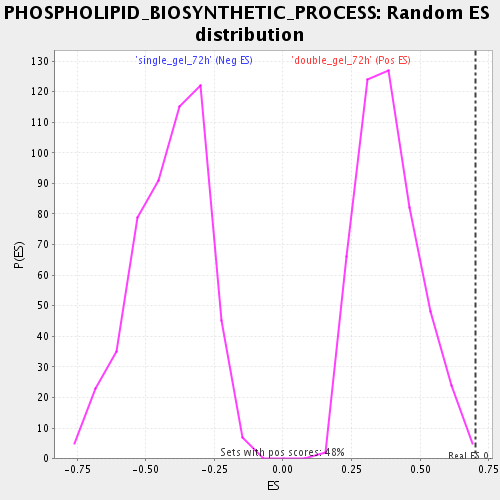
Profile of the Running ES Score & Positions of GeneSet Members on the Rank Ordered List
| Dataset | double_gel_and_single_gel_rma_expression_values_collapsed_to_symbols.class.cls #double_gel_72h_versus_single_gel_72h.class.cls #double_gel_72h_versus_single_gel_72h_repos |
| Phenotype | class.cls#double_gel_72h_versus_single_gel_72h_repos |
| Upregulated in class | double_gel_72h |
| GeneSet | PHOSPHOLIPID_BIOSYNTHETIC_PROCESS |
| Enrichment Score (ES) | 0.7037897 |
| Normalized Enrichment Score (NES) | 1.8208151 |
| Nominal p-value | 0.0020920502 |
| FDR q-value | 0.01269179 |
| FWER p-Value | 0.81 |
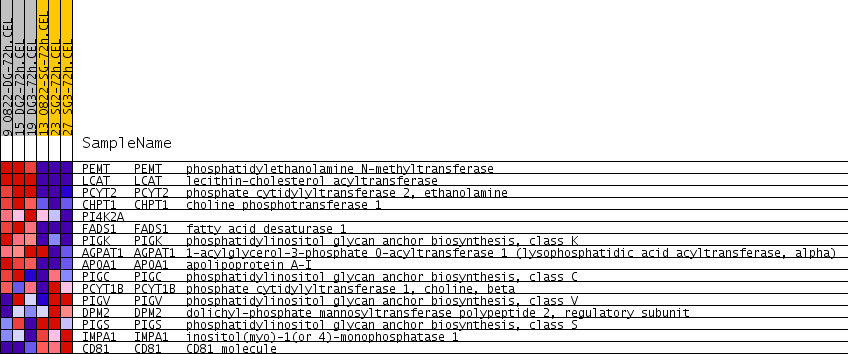
| PROBE | GENE SYMBOL | GENE_TITLE | RANK IN GENE LIST | RANK METRIC SCORE | RUNNING ES | CORE ENRICHMENT | |
|---|---|---|---|---|---|---|---|
| 1 | PEMT | PEMT Entrez, Source | phosphatidylethanolamine N-methyltransferase | 8 | 0.798 | 0.3753 | Yes |
| 2 | LCAT | LCAT Entrez, Source | lecithin-cholesterol acyltransferase | 142 | 0.365 | 0.5374 | Yes |
| 3 | PCYT2 | PCYT2 Entrez, Source | phosphate cytidylyltransferase 2, ethanolamine | 748 | 0.168 | 0.5709 | Yes |
| 4 | CHPT1 | CHPT1 Entrez, Source | choline phosphotransferase 1 | 778 | 0.165 | 0.6462 | Yes |
| 5 | PI4K2A | 1329 | 0.123 | 0.6627 | Yes | ||
| 6 | FADS1 | FADS1 Entrez, Source | fatty acid desaturase 1 | 1495 | 0.114 | 0.7038 | Yes |
| 7 | PIGK | PIGK Entrez, Source | phosphatidylinositol glycan anchor biosynthesis, class K | 3814 | 0.050 | 0.5532 | No |
| 8 | AGPAT1 | AGPAT1 Entrez, Source | 1-acylglycerol-3-phosphate O-acyltransferase 1 (lysophosphatidic acid acyltransferase, alpha) | 4028 | 0.046 | 0.5588 | No |
| 9 | APOA1 | APOA1 Entrez, Source | apolipoprotein A-I | 4169 | 0.043 | 0.5688 | No |
| 10 | PIGC | PIGC Entrez, Source | phosphatidylinositol glycan anchor biosynthesis, class C | 4338 | 0.040 | 0.5752 | No |
| 11 | PCYT1B | PCYT1B Entrez, Source | phosphate cytidylyltransferase 1, choline, beta | 6186 | 0.012 | 0.4420 | No |
| 12 | PIGV | PIGV Entrez, Source | phosphatidylinositol glycan anchor biosynthesis, class V | 7912 | -0.014 | 0.3191 | No |
| 13 | DPM2 | DPM2 Entrez, Source | dolichyl-phosphate mannosyltransferase polypeptide 2, regulatory subunit | 8478 | -0.023 | 0.2873 | No |
| 14 | PIGS | PIGS Entrez, Source | phosphatidylinositol glycan anchor biosynthesis, class S | 9263 | -0.037 | 0.2460 | No |
| 15 | IMPA1 | IMPA1 Entrez, Source | inositol(myo)-1(or 4)-monophosphatase 1 | 9804 | -0.048 | 0.2281 | No |
| 16 | CD81 | CD81 Entrez, Source | CD81 molecule | 11022 | -0.079 | 0.1741 | No |