Profile of the Running ES Score & Positions of GeneSet Members on the Rank Ordered List
| Dataset | double_gel_and_single_gel_rma_expression_values_collapsed_to_symbols.class.cls #double_gel_72h_versus_single_gel_72h.class.cls #double_gel_72h_versus_single_gel_72h_repos |
| Phenotype | class.cls#double_gel_72h_versus_single_gel_72h_repos |
| Upregulated in class | double_gel_72h |
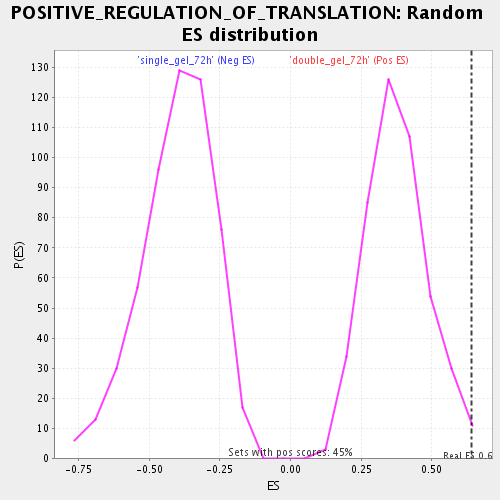
| GeneSet | POSITIVE_REGULATION_OF_TRANSLATION |
| Enrichment Score (ES) | 0.63923264 |
| Normalized Enrichment Score (NES) | 1.6999245 |
| Nominal p-value | 0.006666667 |
| FDR q-value | 0.036328737 |
| FWER p-Value | 0.999 |
| PROBE | GENE SYMBOL | GENE_TITLE | RANK IN GENE LIST | RANK METRIC SCORE | RUNNING ES | CORE ENRICHMENT | |
|---|---|---|---|---|---|---|---|
| 1 | APOA2 | APOA2 Entrez, Source | apolipoprotein A-II | 22 | 0.601 | 0.3367 | Yes |
| 2 | LTB | LTB Entrez, Source | lymphotoxin beta (TNF superfamily, member 3) | 35 | 0.539 | 0.6392 | Yes |
| 3 | SPN | SPN Entrez, Source | sialophorin (leukosialin, CD43) | 2741 | 0.073 | 0.4772 | No |
| 4 | TLR4 | TLR4 Entrez, Source | toll-like receptor 4 | 4308 | 0.041 | 0.3829 | No |
| 5 | EIF2B5 | EIF2B5 Entrez, Source | eukaryotic translation initiation factor 2B, subunit 5 epsilon, 82kDa | 4827 | 0.032 | 0.3620 | No |
| 6 | IL12B | IL12B Entrez, Source | interleukin 12B (natural killer cell stimulatory factor 2, cytotoxic lymphocyte maturation factor 2, p40) | 6003 | 0.014 | 0.2818 | No |
| 7 | IL4 | IL4 Entrez, Source | interleukin 4 | 6466 | 0.007 | 0.2509 | No |
| 8 | BCL10 | BCL10 Entrez, Source | B-cell CLL/lymphoma 10 | 6471 | 0.007 | 0.2544 | No |
| 9 | TNFRSF8 | TNFRSF8 Entrez, Source | tumor necrosis factor receptor superfamily, member 8 | 7122 | -0.002 | 0.2068 | No |
| 10 | GLMN | GLMN Entrez, Source | glomulin, FKBP associated protein | 7210 | -0.003 | 0.2021 | No |
| 11 | IL6 | IL6 Entrez, Source | interleukin 6 (interferon, beta 2) | 7239 | -0.004 | 0.2020 | No |
| 12 | CD28 | CD28 Entrez, Source | CD28 molecule | 7763 | -0.011 | 0.1692 | No |
| 13 | EIF5A | EIF5A Entrez, Source | eukaryotic translation initiation factor 5A | 8430 | -0.022 | 0.1316 | No |
| 14 | EREG | EREG Entrez, Source | epiregulin | 9343 | -0.039 | 0.0848 | No |
| 15 | ELA2 | ELA2 Entrez, Source | elastase 2, neutrophil | 10427 | -0.062 | 0.0386 | No |
| 16 | CD276 | CD276 Entrez, Source | CD276 molecule | 13052 | -0.320 | 0.0218 | No |