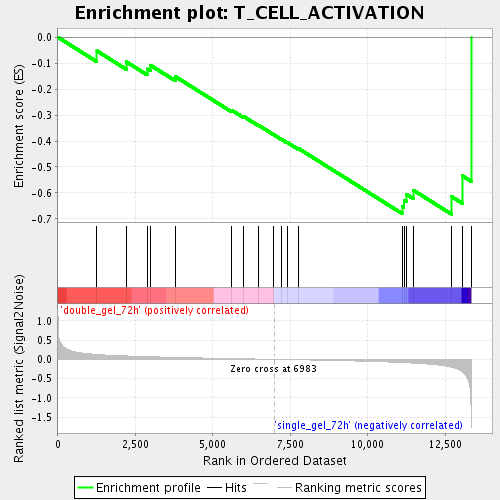
Profile of the Running ES Score & Positions of GeneSet Members on the Rank Ordered List
| Dataset | double_gel_and_single_gel_rma_expression_values_collapsed_to_symbols.class.cls #double_gel_72h_versus_single_gel_72h.class.cls #double_gel_72h_versus_single_gel_72h_repos |
| Phenotype | class.cls#double_gel_72h_versus_single_gel_72h_repos |
| Upregulated in class | single_gel_72h |
| GeneSet | T_CELL_ACTIVATION |
| Enrichment Score (ES) | -0.6815143 |
| Normalized Enrichment Score (NES) | -1.7279234 |
| Nominal p-value | 0.0018621974 |
| FDR q-value | 0.052928645 |
| FWER p-Value | 1.0 |
| PROBE | GENE SYMBOL | GENE_TITLE | RANK IN GENE LIST | RANK METRIC SCORE | RUNNING ES | CORE ENRICHMENT | |
|---|---|---|---|---|---|---|---|
| 1 | IL2 | IL2 Entrez, Source | interleukin 2 | 1260 | 0.126 | -0.0527 | No |
| 2 | JAG2 | JAG2 Entrez, Source | jagged 2 | 2207 | 0.088 | -0.0945 | No |
| 3 | SFTPD | SFTPD Entrez, Source | surfactant, pulmonary-associated protein D | 2883 | 0.069 | -0.1222 | No |
| 4 | CD4 | CD4 Entrez, Source | CD4 molecule | 2984 | 0.067 | -0.1075 | No |
| 5 | CD2 | CD2 Entrez, Source | CD2 molecule | 3794 | 0.050 | -0.1517 | No |
| 6 | PTPRC | PTPRC Entrez, Source | protein tyrosine phosphatase, receptor type, C | 5608 | 0.020 | -0.2810 | No |
| 7 | IL12B | IL12B Entrez, Source | interleukin 12B (natural killer cell stimulatory factor 2, cytotoxic lymphocyte maturation factor 2, p40) | 6003 | 0.014 | -0.3059 | No |
| 8 | IL4 | IL4 Entrez, Source | interleukin 4 | 6466 | 0.007 | -0.3383 | No |
| 9 | SART1 | SART1 Entrez, Source | squamous cell carcinoma antigen recognised by T cells | 6969 | 0.000 | -0.3760 | No |
| 10 | GLMN | GLMN Entrez, Source | glomulin, FKBP associated protein | 7210 | -0.003 | -0.3929 | No |
| 11 | LAT | LAT Entrez, Source | linker for activation of T cells | 7393 | -0.006 | -0.4046 | No |
| 12 | CD28 | CD28 Entrez, Source | CD28 molecule | 7763 | -0.011 | -0.4285 | No |
| 13 | IL7 | IL7 Entrez, Source | interleukin 7 | 11123 | -0.083 | -0.6532 | Yes |
| 14 | THY1 | THY1 Entrez, Source | Thy-1 cell surface antigen | 11169 | -0.084 | -0.6285 | Yes |
| 15 | IL18 | IL18 Entrez, Source | interleukin 18 (interferon-gamma-inducing factor) | 11246 | -0.088 | -0.6052 | Yes |
| 16 | CD3D | CD3D Entrez, Source | CD3d molecule, delta (CD3-TCR complex) | 11471 | -0.098 | -0.5893 | Yes |
| 17 | CD47 | CD47 Entrez, Source | CD47 molecule | 12700 | -0.205 | -0.6136 | Yes |
| 18 | CD276 | CD276 Entrez, Source | CD276 molecule | 13052 | -0.320 | -0.5338 | Yes |
| 19 | CD24 | CD24 Entrez, Source | CD24 molecule | 13341 | -1.675 | 0.0001 | Yes |

