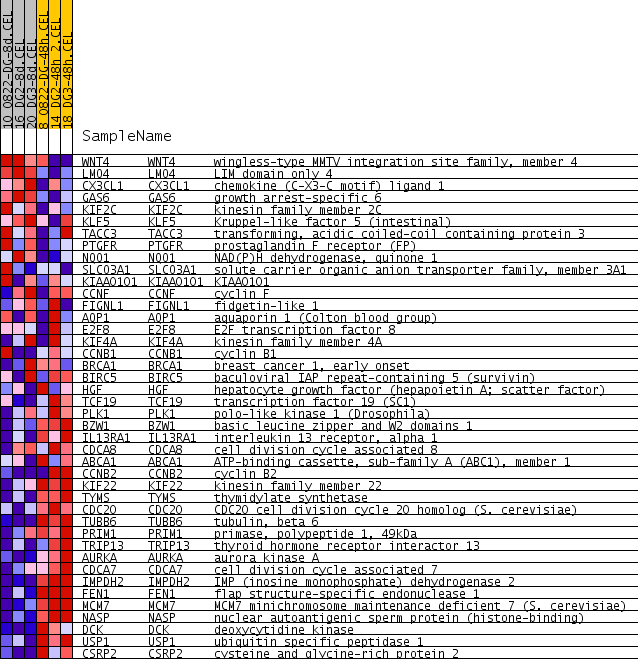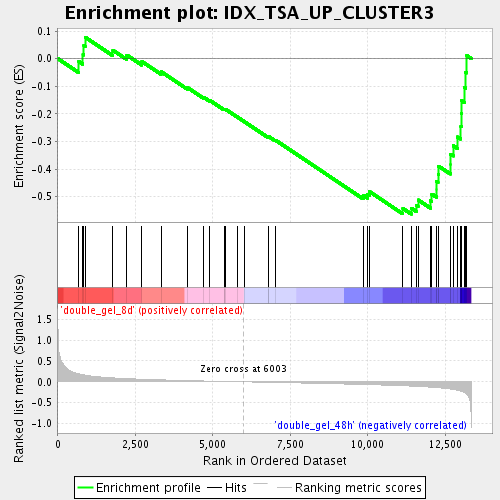
Profile of the Running ES Score & Positions of GeneSet Members on the Rank Ordered List
| Dataset | double_gel_and_single_gel_rma_expression_values_collapsed_to_symbols.class.cls #double_gel_8d_versus_double_gel_48h.class.cls #double_gel_8d_versus_double_gel_48h_repos |
| Phenotype | class.cls#double_gel_8d_versus_double_gel_48h_repos |
| Upregulated in class | double_gel_48h |
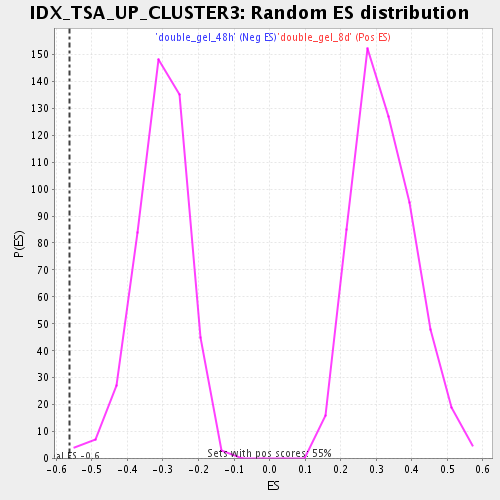
| GeneSet | IDX_TSA_UP_CLUSTER3 |
| Enrichment Score (ES) | -0.5630888 |
| Normalized Enrichment Score (NES) | -1.847017 |
| Nominal p-value | 0.0022075055 |
| FDR q-value | 0.03868974 |
| FWER p-Value | 0.74 |
| PROBE | GENE SYMBOL | GENE_TITLE | RANK IN GENE LIST | RANK METRIC SCORE | RUNNING ES | CORE ENRICHMENT | |
|---|---|---|---|---|---|---|---|
| 1 | WNT4 | WNT4 Entrez, Source | wingless-type MMTV integration site family, member 4 | 672 | 0.191 | -0.0103 | No |
| 2 | LMO4 | LMO4 Entrez, Source | LIM domain only 4 | 808 | 0.169 | 0.0151 | No |
| 3 | CX3CL1 | CX3CL1 Entrez, Source | chemokine (C-X3-C motif) ligand 1 | 837 | 0.164 | 0.0476 | No |
| 4 | GAS6 | GAS6 Entrez, Source | growth arrest-specific 6 | 883 | 0.158 | 0.0776 | No |
| 5 | KIF2C | KIF2C Entrez, Source | kinesin family member 2C | 1773 | 0.094 | 0.0306 | No |
| 6 | KLF5 | KLF5 Entrez, Source | Kruppel-like factor 5 (intestinal) | 2220 | 0.077 | 0.0132 | No |
| 7 | TACC3 | TACC3 Entrez, Source | transforming, acidic coiled-coil containing protein 3 | 2708 | 0.062 | -0.0102 | No |
| 8 | PTGFR | PTGFR Entrez, Source | prostaglandin F receptor (FP) | 3331 | 0.047 | -0.0472 | No |
| 9 | NQO1 | NQO1 Entrez, Source | NAD(P)H dehydrogenase, quinone 1 | 4179 | 0.030 | -0.1046 | No |
| 10 | SLCO3A1 | SLCO3A1 Entrez, Source | solute carrier organic anion transporter family, member 3A1 | 4711 | 0.020 | -0.1404 | No |
| 11 | KIAA0101 | KIAA0101 Entrez, Source | KIAA0101 | 4903 | 0.017 | -0.1512 | No |
| 12 | CCNF | CCNF Entrez, Source | cyclin F | 5366 | 0.009 | -0.1840 | No |
| 13 | FIGNL1 | FIGNL1 Entrez, Source | fidgetin-like 1 | 5379 | 0.009 | -0.1830 | No |
| 14 | AQP1 | AQP1 Entrez, Source | aquaporin 1 (Colton blood group) | 5400 | 0.009 | -0.1827 | No |
| 15 | E2F8 | E2F8 Entrez, Source | E2F transcription factor 8 | 5781 | 0.003 | -0.2106 | No |
| 16 | KIF4A | KIF4A Entrez, Source | kinesin family member 4A | 6014 | -0.000 | -0.2280 | No |
| 17 | CCNB1 | CCNB1 Entrez, Source | cyclin B1 | 6785 | -0.012 | -0.2834 | No |
| 18 | BRCA1 | BRCA1 Entrez, Source | breast cancer 1, early onset | 6790 | -0.012 | -0.2812 | No |
| 19 | BIRC5 | BIRC5 Entrez, Source | baculoviral IAP repeat-containing 5 (survivin) | 7015 | -0.015 | -0.2948 | No |
| 20 | HGF | HGF Entrez, Source | hepatocyte growth factor (hepapoietin A; scatter factor) | 9857 | -0.063 | -0.4950 | No |
| 21 | TCF19 | TCF19 Entrez, Source | transcription factor 19 (SC1) | 9995 | -0.066 | -0.4914 | No |
| 22 | PLK1 | PLK1 Entrez, Source | polo-like kinase 1 (Drosophila) | 10056 | -0.067 | -0.4817 | No |
| 23 | BZW1 | BZW1 Entrez, Source | basic leucine zipper and W2 domains 1 | 11133 | -0.094 | -0.5427 | Yes |
| 24 | IL13RA1 | IL13RA1 Entrez, Source | interleukin 13 receptor, alpha 1 | 11405 | -0.102 | -0.5415 | Yes |
| 25 | CDCA8 | CDCA8 Entrez, Source | cell division cycle associated 8 | 11577 | -0.108 | -0.5315 | Yes |
| 26 | ABCA1 | ABCA1 Entrez, Source | ATP-binding cassette, sub-family A (ABC1), member 1 | 11627 | -0.110 | -0.5119 | Yes |
| 27 | CCNB2 | CCNB2 Entrez, Source | cyclin B2 | 12025 | -0.128 | -0.5148 | Yes |
| 28 | KIF22 | KIF22 Entrez, Source | kinesin family member 22 | 12066 | -0.130 | -0.4904 | Yes |
| 29 | TYMS | TYMS Entrez, Source | thymidylate synthetase | 12217 | -0.137 | -0.4727 | Yes |
| 30 | CDC20 | CDC20 Entrez, Source | CDC20 cell division cycle 20 homolog (S. cerevisiae) | 12218 | -0.137 | -0.4438 | Yes |
| 31 | TUBB6 | TUBB6 Entrez, Source | tubulin, beta 6 | 12270 | -0.141 | -0.4179 | Yes |
| 32 | PRIM1 | PRIM1 Entrez, Source | primase, polypeptide 1, 49kDa | 12284 | -0.141 | -0.3891 | Yes |
| 33 | TRIP13 | TRIP13 Entrez, Source | thyroid hormone receptor interactor 13 | 12670 | -0.170 | -0.3822 | Yes |
| 34 | AURKA | AURKA Entrez, Source | aurora kinase A | 12673 | -0.170 | -0.3464 | Yes |
| 35 | CDCA7 | CDCA7 Entrez, Source | cell division cycle associated 7 | 12759 | -0.178 | -0.3151 | Yes |
| 36 | IMPDH2 | IMPDH2 Entrez, Source | IMP (inosine monophosphate) dehydrogenase 2 | 12899 | -0.199 | -0.2835 | Yes |
| 37 | FEN1 | FEN1 Entrez, Source | flap structure-specific endonuclease 1 | 13004 | -0.219 | -0.2452 | Yes |
| 38 | MCM7 | MCM7 Entrez, Source | MCM7 minichromosome maintenance deficient 7 (S. cerevisiae) | 13021 | -0.223 | -0.1993 | Yes |
| 39 | NASP | NASP Entrez, Source | nuclear autoantigenic sperm protein (histone-binding) | 13031 | -0.226 | -0.1524 | Yes |
| 40 | DCK | DCK Entrez, Source | deoxycytidine kinase | 13118 | -0.258 | -0.1044 | Yes |
| 41 | USP1 | USP1 Entrez, Source | ubiquitin specific peptidase 1 | 13158 | -0.275 | -0.0493 | Yes |
| 42 | CSRP2 | CSRP2 Entrez, Source | cysteine and glycine-rich protein 2 | 13196 | -0.299 | 0.0110 | Yes |