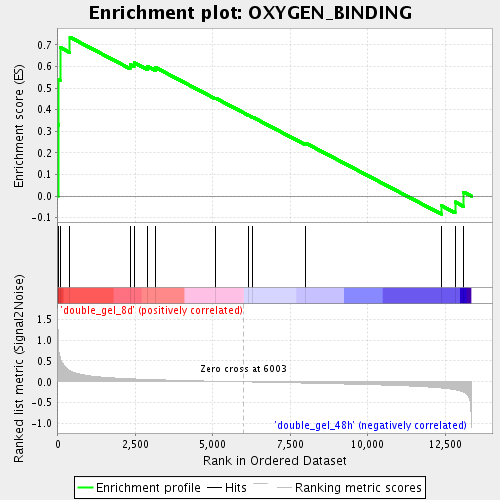
Profile of the Running ES Score & Positions of GeneSet Members on the Rank Ordered List
| Dataset | double_gel_and_single_gel_rma_expression_values_collapsed_to_symbols.class.cls #double_gel_8d_versus_double_gel_48h.class.cls #double_gel_8d_versus_double_gel_48h_repos |
| Phenotype | class.cls#double_gel_8d_versus_double_gel_48h_repos |
| Upregulated in class | double_gel_8d |
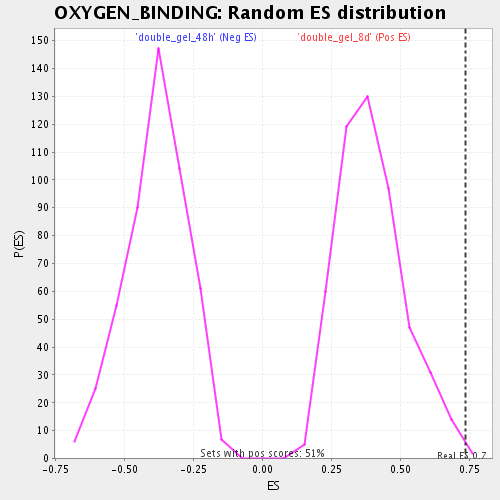
| GeneSet | OXYGEN_BINDING |
| Enrichment Score (ES) | 0.7348324 |
| Normalized Enrichment Score (NES) | 1.8545735 |
| Nominal p-value | 0.003960396 |
| FDR q-value | 0.018178755 |
| FWER p-Value | 0.828 |
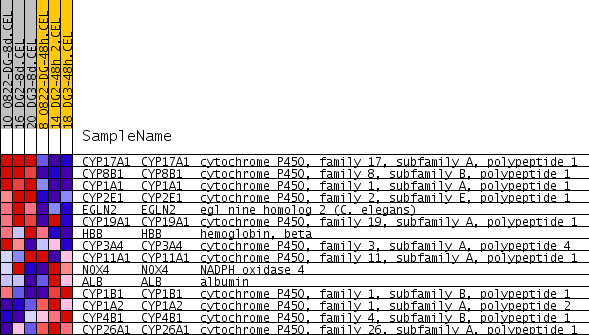
| PROBE | GENE SYMBOL | GENE_TITLE | RANK IN GENE LIST | RANK METRIC SCORE | RUNNING ES | CORE ENRICHMENT | |
|---|---|---|---|---|---|---|---|
| 1 | CYP17A1 | CYP17A1 Entrez, Source | cytochrome P450, family 17, subfamily A, polypeptide 1 | 3 | 1.233 | 0.3298 | Yes |
| 2 | CYP8B1 | CYP8B1 Entrez, Source | cytochrome P450, family 8, subfamily B, polypeptide 1 | 23 | 0.784 | 0.5383 | Yes |
| 3 | CYP1A1 | CYP1A1 Entrez, Source | cytochrome P450, family 1, subfamily A, polypeptide 1 | 72 | 0.571 | 0.6877 | Yes |
| 4 | CYP2E1 | CYP2E1 Entrez, Source | cytochrome P450, family 2, subfamily E, polypeptide 1 | 389 | 0.265 | 0.7348 | Yes |
| 5 | EGLN2 | EGLN2 Entrez, Source | egl nine homolog 2 (C. elegans) | 2331 | 0.073 | 0.6087 | No |
| 6 | CYP19A1 | CYP19A1 Entrez, Source | cytochrome P450, family 19, subfamily A, polypeptide 1 | 2460 | 0.069 | 0.6176 | No |
| 7 | HBB | HBB Entrez, Source | hemoglobin, beta | 2898 | 0.057 | 0.6002 | No |
| 8 | CYP3A4 | CYP3A4 Entrez, Source | cytochrome P450, family 3, subfamily A, polypeptide 4 | 3149 | 0.051 | 0.5951 | No |
| 9 | CYP11A1 | CYP11A1 Entrez, Source | cytochrome P450, family 11, subfamily A, polypeptide 1 | 5093 | 0.014 | 0.4529 | No |
| 10 | NOX4 | NOX4 Entrez, Source | NADPH oxidase 4 | 6149 | -0.002 | 0.3743 | No |
| 11 | ALB | ALB Entrez, Source | albumin | 6276 | -0.004 | 0.3660 | No |
| 12 | CYP1B1 | CYP1B1 Entrez, Source | cytochrome P450, family 1, subfamily B, polypeptide 1 | 7989 | -0.031 | 0.2458 | No |
| 13 | CYP1A2 | CYP1A2 Entrez, Source | cytochrome P450, family 1, subfamily A, polypeptide 2 | 12372 | -0.147 | -0.0437 | No |
| 14 | CYP4B1 | CYP4B1 Entrez, Source | cytochrome P450, family 4, subfamily B, polypeptide 1 | 12818 | -0.188 | -0.0268 | No |
| 15 | CYP26A1 | CYP26A1 Entrez, Source | cytochrome P450, family 26, subfamily A, polypeptide 1 | 13087 | -0.247 | 0.0191 | No |