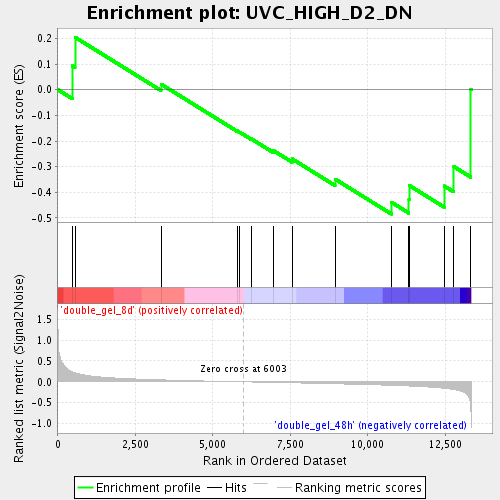
Profile of the Running ES Score & Positions of GeneSet Members on the Rank Ordered List
| Dataset | double_gel_and_single_gel_rma_expression_values_collapsed_to_symbols.class.cls #double_gel_8d_versus_double_gel_48h.class.cls #double_gel_8d_versus_double_gel_48h_repos |
| Phenotype | class.cls#double_gel_8d_versus_double_gel_48h_repos |
| Upregulated in class | double_gel_48h |
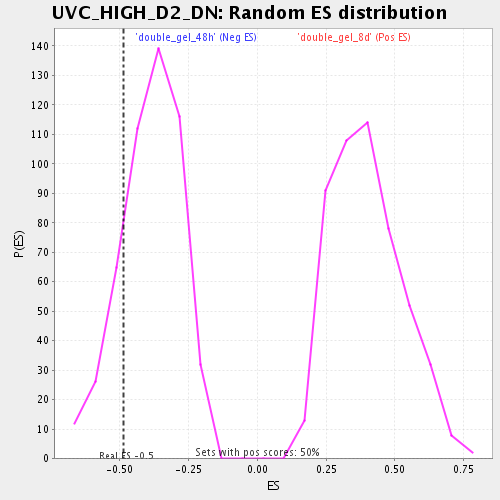
| GeneSet | UVC_HIGH_D2_DN |
| Enrichment Score (ES) | -0.4851585 |
| Normalized Enrichment Score (NES) | -1.2533584 |
| Nominal p-value | 0.1812749 |
| FDR q-value | 0.52673024 |
| FWER p-Value | 1.0 |
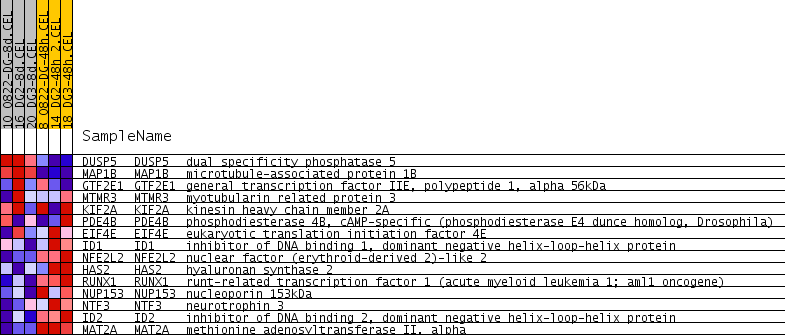
| PROBE | GENE SYMBOL | GENE_TITLE | RANK IN GENE LIST | RANK METRIC SCORE | RUNNING ES | CORE ENRICHMENT | |
|---|---|---|---|---|---|---|---|
| 1 | DUSP5 | DUSP5 Entrez, Source | dual specificity phosphatase 5 | 472 | 0.237 | 0.0932 | No |
| 2 | MAP1B | MAP1B Entrez, Source | microtubule-associated protein 1B | 552 | 0.216 | 0.2049 | No |
| 3 | GTF2E1 | GTF2E1 Entrez, Source | general transcription factor IIE, polypeptide 1, alpha 56kDa | 3328 | 0.047 | 0.0220 | No |
| 4 | MTMR3 | MTMR3 Entrez, Source | myotubularin related protein 3 | 5782 | 0.003 | -0.1604 | No |
| 5 | KIF2A | KIF2A Entrez, Source | kinesin heavy chain member 2A | 5869 | 0.002 | -0.1658 | No |
| 6 | PDE4B | PDE4B Entrez, Source | phosphodiesterase 4B, cAMP-specific (phosphodiesterase E4 dunce homolog, Drosophila) | 6239 | -0.004 | -0.1915 | No |
| 7 | EIF4E | EIF4E Entrez, Source | eukaryotic translation initiation factor 4E | 6949 | -0.014 | -0.2369 | No |
| 8 | ID1 | ID1 Entrez, Source | inhibitor of DNA binding 1, dominant negative helix-loop-helix protein | 7557 | -0.023 | -0.2697 | No |
| 9 | NFE2L2 | NFE2L2 Entrez, Source | nuclear factor (erythroid-derived 2)-like 2 | 8944 | -0.046 | -0.3485 | No |
| 10 | HAS2 | HAS2 Entrez, Source | hyaluronan synthase 2 | 10766 | -0.084 | -0.4393 | Yes |
| 11 | RUNX1 | RUNX1 Entrez, Source | runt-related transcription factor 1 (acute myeloid leukemia 1; aml1 oncogene) | 11329 | -0.100 | -0.4272 | Yes |
| 12 | NUP153 | NUP153 Entrez, Source | nucleoporin 153kDa | 11338 | -0.100 | -0.3735 | Yes |
| 13 | NTF3 | NTF3 Entrez, Source | neurotrophin 3 | 12465 | -0.152 | -0.3752 | Yes |
| 14 | ID2 | ID2 Entrez, Source | inhibitor of DNA binding 2, dominant negative helix-loop-helix protein | 12777 | -0.181 | -0.3000 | Yes |
| 15 | MAT2A | MAT2A Entrez, Source | methionine adenosyltransferase II, alpha | 13326 | -0.630 | 0.0012 | Yes |