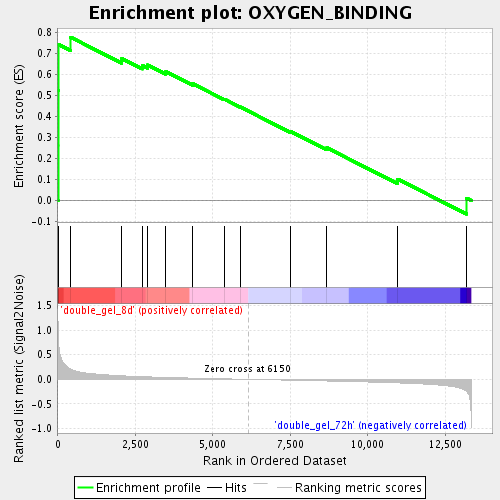
Profile of the Running ES Score & Positions of GeneSet Members on the Rank Ordered List
| Dataset | double_gel_and_single_gel_rma_expression_values_collapsed_to_symbols.class.cls #double_gel_8d_versus_double_gel_72h.class.cls #double_gel_8d_versus_double_gel_72h_repos |
| Phenotype | class.cls#double_gel_8d_versus_double_gel_72h_repos |
| Upregulated in class | double_gel_8d |
| GeneSet | OXYGEN_BINDING |
| Enrichment Score (ES) | 0.77768254 |
| Normalized Enrichment Score (NES) | 1.9196552 |
| Nominal p-value | 0.0 |
| FDR q-value | 0.012797519 |
| FWER p-Value | 0.524 |
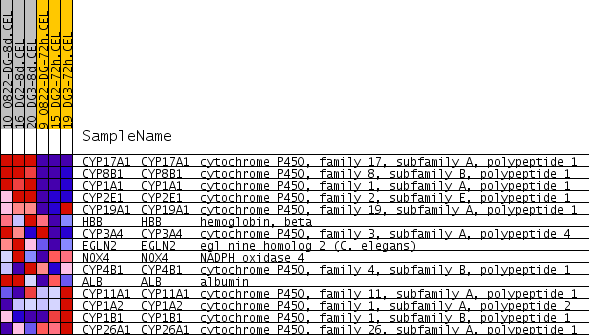
| PROBE | GENE SYMBOL | GENE_TITLE | RANK IN GENE LIST | RANK METRIC SCORE | RUNNING ES | CORE ENRICHMENT | |
|---|---|---|---|---|---|---|---|
| 1 | CYP17A1 | CYP17A1 Entrez, Source | cytochrome P450, family 17, subfamily A, polypeptide 1 | 8 | 0.860 | 0.2641 | Yes |
| 2 | CYP8B1 | CYP8B1 Entrez, Source | cytochrome P450, family 8, subfamily B, polypeptide 1 | 9 | 0.851 | 0.5262 | Yes |
| 3 | CYP1A1 | CYP1A1 Entrez, Source | cytochrome P450, family 1, subfamily A, polypeptide 1 | 18 | 0.708 | 0.7437 | Yes |
| 4 | CYP2E1 | CYP2E1 Entrez, Source | cytochrome P450, family 2, subfamily E, polypeptide 1 | 412 | 0.206 | 0.7777 | Yes |
| 5 | CYP19A1 | CYP19A1 Entrez, Source | cytochrome P450, family 19, subfamily A, polypeptide 1 | 2059 | 0.071 | 0.6760 | No |
| 6 | HBB | HBB Entrez, Source | hemoglobin, beta | 2720 | 0.055 | 0.6434 | No |
| 7 | CYP3A4 | CYP3A4 Entrez, Source | cytochrome P450, family 3, subfamily A, polypeptide 4 | 2896 | 0.051 | 0.6459 | No |
| 8 | EGLN2 | EGLN2 Entrez, Source | egl nine homolog 2 (C. elegans) | 3481 | 0.039 | 0.6140 | No |
| 9 | NOX4 | NOX4 Entrez, Source | NADPH oxidase 4 | 4346 | 0.025 | 0.5568 | No |
| 10 | CYP4B1 | CYP4B1 Entrez, Source | cytochrome P450, family 4, subfamily B, polypeptide 1 | 5380 | 0.010 | 0.4824 | No |
| 11 | ALB | ALB Entrez, Source | albumin | 5881 | 0.004 | 0.4460 | No |
| 12 | CYP11A1 | CYP11A1 Entrez, Source | cytochrome P450, family 11, subfamily A, polypeptide 1 | 7492 | -0.017 | 0.3303 | No |
| 13 | CYP1A2 | CYP1A2 Entrez, Source | cytochrome P450, family 1, subfamily A, polypeptide 2 | 8681 | -0.033 | 0.2514 | No |
| 14 | CYP1B1 | CYP1B1 Entrez, Source | cytochrome P450, family 1, subfamily B, polypeptide 1 | 10964 | -0.073 | 0.1025 | No |
| 15 | CYP26A1 | CYP26A1 Entrez, Source | cytochrome P450, family 26, subfamily A, polypeptide 1 | 13188 | -0.246 | 0.0116 | No |