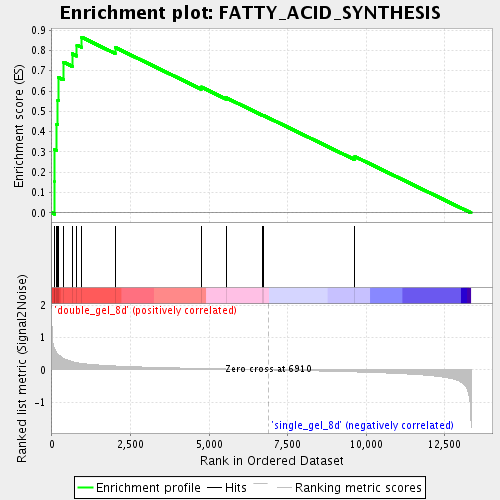
Profile of the Running ES Score & Positions of GeneSet Members on the Rank Ordered List
| Dataset | double_gel_and_single_gel_rma_expression_values_collapsed_to_symbols.class.cls #double_gel_8d_versus_single_gel_8d.class.cls #double_gel_8d_versus_single_gel_8d_repos |
| Phenotype | class.cls#double_gel_8d_versus_single_gel_8d_repos |
| Upregulated in class | double_gel_8d |
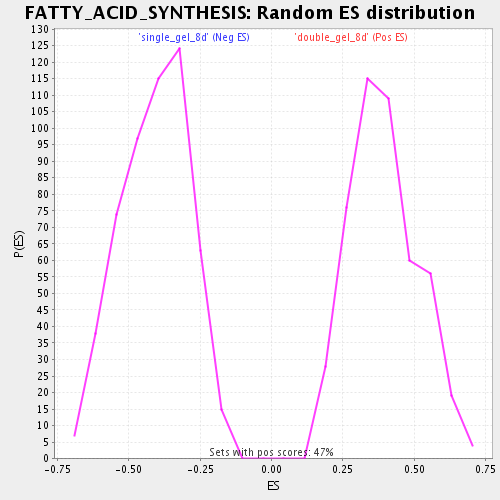
| GeneSet | FATTY_ACID_SYNTHESIS |
| Enrichment Score (ES) | 0.8650006 |
| Normalized Enrichment Score (NES) | 2.1993654 |
| Nominal p-value | 0.0 |
| FDR q-value | 7.883109E-5 |
| FWER p-Value | 0.0030 |
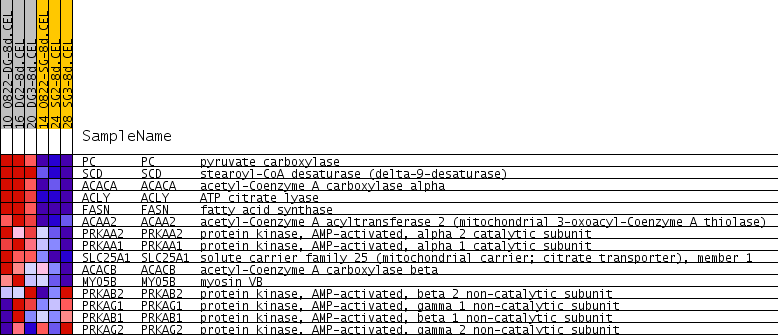
| PROBE | GENE SYMBOL | GENE_TITLE | RANK IN GENE LIST | RANK METRIC SCORE | RUNNING ES | CORE ENRICHMENT | |
|---|---|---|---|---|---|---|---|
| 1 | PC | PC Entrez, Source | pyruvate carboxylase | 79 | 0.652 | 0.1549 | Yes |
| 2 | SCD | SCD Entrez, Source | stearoyl-CoA desaturase (delta-9-desaturase) | 84 | 0.641 | 0.3128 | Yes |
| 3 | ACACA | ACACA Entrez, Source | acetyl-Coenzyme A carboxylase alpha | 154 | 0.527 | 0.4376 | Yes |
| 4 | ACLY | ACLY Entrez, Source | ATP citrate lyase | 186 | 0.487 | 0.5553 | Yes |
| 5 | FASN | FASN Entrez, Source | fatty acid synthase | 213 | 0.460 | 0.6668 | Yes |
| 6 | ACAA2 | ACAA2 Entrez, Source | acetyl-Coenzyme A acyltransferase 2 (mitochondrial 3-oxoacyl-Coenzyme A thiolase) | 374 | 0.353 | 0.7418 | Yes |
| 7 | PRKAA2 | PRKAA2 Entrez, Source | protein kinase, AMP-activated, alpha 2 catalytic subunit | 649 | 0.252 | 0.7834 | Yes |
| 8 | PRKAA1 | PRKAA1 Entrez, Source | protein kinase, AMP-activated, alpha 1 catalytic subunit | 796 | 0.220 | 0.8268 | Yes |
| 9 | SLC25A1 | SLC25A1 Entrez, Source | solute carrier family 25 (mitochondrial carrier; citrate transporter), member 1 | 946 | 0.200 | 0.8650 | Yes |
| 10 | ACACB | ACACB Entrez, Source | acetyl-Coenzyme A carboxylase beta | 2014 | 0.121 | 0.8148 | No |
| 11 | MYO5B | MYO5B Entrez, Source | myosin VB | 4750 | 0.043 | 0.6201 | No |
| 12 | PRKAB2 | PRKAB2 Entrez, Source | protein kinase, AMP-activated, beta 2 non-catalytic subunit | 5547 | 0.027 | 0.5670 | No |
| 13 | PRKAG1 | PRKAG1 Entrez, Source | protein kinase, AMP-activated, gamma 1 non-catalytic subunit | 6702 | 0.004 | 0.4814 | No |
| 14 | PRKAB1 | PRKAB1 Entrez, Source | protein kinase, AMP-activated, beta 1 non-catalytic subunit | 6723 | 0.004 | 0.4808 | No |
| 15 | PRKAG2 | PRKAG2 Entrez, Source | protein kinase, AMP-activated, gamma 2 non-catalytic subunit | 9644 | -0.064 | 0.2775 | No |