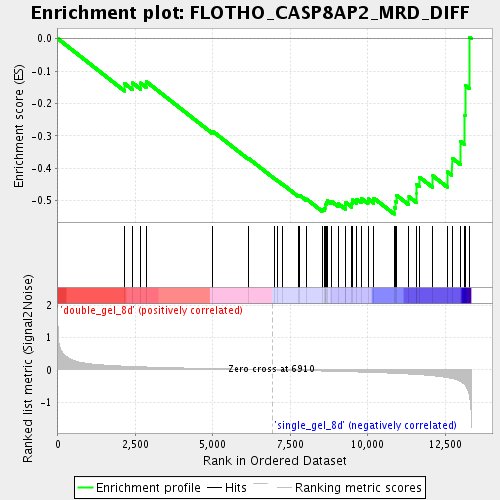
Profile of the Running ES Score & Positions of GeneSet Members on the Rank Ordered List
| Dataset | double_gel_and_single_gel_rma_expression_values_collapsed_to_symbols.class.cls #double_gel_8d_versus_single_gel_8d.class.cls #double_gel_8d_versus_single_gel_8d_repos |
| Phenotype | class.cls#double_gel_8d_versus_single_gel_8d_repos |
| Upregulated in class | single_gel_8d |
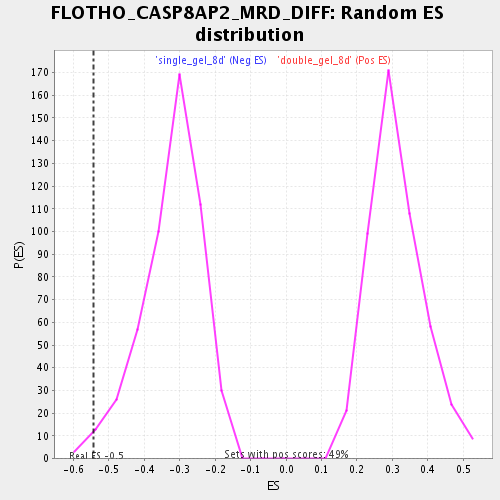
| GeneSet | FLOTHO_CASP8AP2_MRD_DIFF |
| Enrichment Score (ES) | -0.542028 |
| Normalized Enrichment Score (NES) | -1.6814455 |
| Nominal p-value | 0.011764706 |
| FDR q-value | 0.081315115 |
| FWER p-Value | 1.0 |
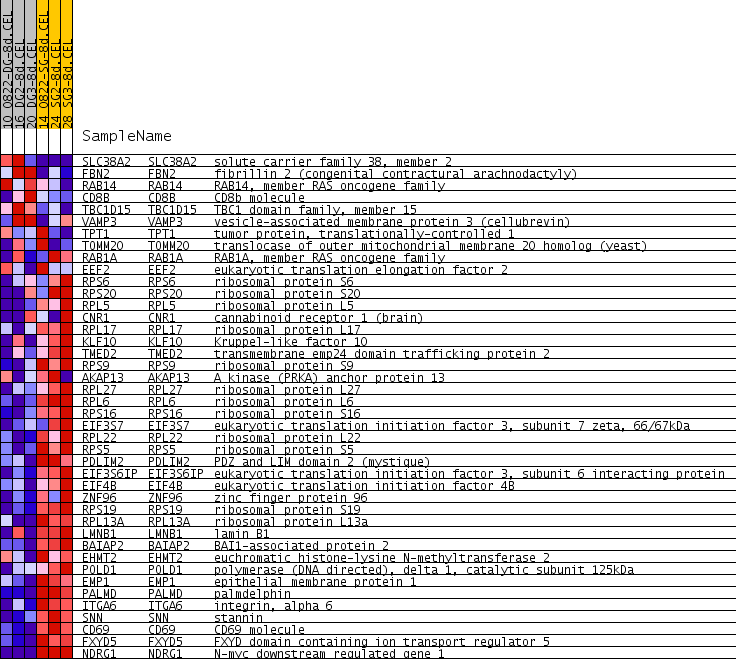
| PROBE | GENE SYMBOL | GENE_TITLE | RANK IN GENE LIST | RANK METRIC SCORE | RUNNING ES | CORE ENRICHMENT | |
|---|---|---|---|---|---|---|---|
| 1 | SLC38A2 | SLC38A2 Entrez, Source | solute carrier family 38, member 2 | 2153 | 0.116 | -0.1387 | No |
| 2 | FBN2 | FBN2 Entrez, Source | fibrillin 2 (congenital contractural arachnodactyly) | 2408 | 0.106 | -0.1365 | No |
| 3 | RAB14 | RAB14 Entrez, Source | RAB14, member RAS oncogene family | 2668 | 0.097 | -0.1367 | No |
| 4 | CD8B | CD8B Entrez, Source | CD8b molecule | 2848 | 0.090 | -0.1322 | No |
| 5 | TBC1D15 | TBC1D15 Entrez, Source | TBC1 domain family, member 15 | 4997 | 0.038 | -0.2861 | No |
| 6 | VAMP3 | VAMP3 Entrez, Source | vesicle-associated membrane protein 3 (cellubrevin) | 6158 | 0.015 | -0.3703 | No |
| 7 | TPT1 | TPT1 Entrez, Source | tumor protein, translationally-controlled 1 | 6974 | -0.002 | -0.4313 | No |
| 8 | TOMM20 | TOMM20 Entrez, Source | translocase of outer mitochondrial membrane 20 homolog (yeast) | 7072 | -0.004 | -0.4378 | No |
| 9 | RAB1A | RAB1A Entrez, Source | RAB1A, member RAS oncogene family | 7239 | -0.007 | -0.4489 | No |
| 10 | EEF2 | EEF2 Entrez, Source | eukaryotic translation elongation factor 2 | 7765 | -0.018 | -0.4848 | No |
| 11 | RPS6 | RPS6 Entrez, Source | ribosomal protein S6 | 7800 | -0.019 | -0.4836 | No |
| 12 | RPS20 | RPS20 Entrez, Source | ribosomal protein S20 | 8019 | -0.024 | -0.4952 | No |
| 13 | RPL5 | RPL5 Entrez, Source | ribosomal protein L5 | 8527 | -0.035 | -0.5263 | Yes |
| 14 | CNR1 | CNR1 Entrez, Source | cannabinoid receptor 1 (brain) | 8601 | -0.037 | -0.5245 | Yes |
| 15 | RPL17 | RPL17 Entrez, Source | ribosomal protein L17 | 8625 | -0.037 | -0.5187 | Yes |
| 16 | KLF10 | KLF10 Entrez, Source | Kruppel-like factor 10 | 8626 | -0.037 | -0.5113 | Yes |
| 17 | TMED2 | TMED2 Entrez, Source | transmembrane emp24 domain trafficking protein 2 | 8660 | -0.038 | -0.5062 | Yes |
| 18 | RPS9 | RPS9 Entrez, Source | ribosomal protein S9 | 8689 | -0.039 | -0.5005 | Yes |
| 19 | AKAP13 | AKAP13 Entrez, Source | A kinase (PRKA) anchor protein 13 | 8818 | -0.041 | -0.5019 | Yes |
| 20 | RPL27 | RPL27 Entrez, Source | ribosomal protein L27 | 9053 | -0.047 | -0.5100 | Yes |
| 21 | RPL6 | RPL6 Entrez, Source | ribosomal protein L6 | 9278 | -0.054 | -0.5161 | Yes |
| 22 | RPS16 | RPS16 Entrez, Source | ribosomal protein S16 | 9287 | -0.054 | -0.5059 | Yes |
| 23 | EIF3S7 | EIF3S7 Entrez, Source | eukaryotic translation initiation factor 3, subunit 7 zeta, 66/67kDa | 9487 | -0.059 | -0.5090 | Yes |
| 24 | RPL22 | RPL22 Entrez, Source | ribosomal protein L22 | 9500 | -0.060 | -0.4980 | Yes |
| 25 | RPS5 | RPS5 Entrez, Source | ribosomal protein S5 | 9640 | -0.064 | -0.4957 | Yes |
| 26 | PDLIM2 | PDLIM2 Entrez, Source | PDZ and LIM domain 2 (mystique) | 9795 | -0.068 | -0.4938 | Yes |
| 27 | EIF3S6IP | EIF3S6IP Entrez, Source | eukaryotic translation initiation factor 3, subunit 6 interacting protein | 10010 | -0.075 | -0.4949 | Yes |
| 28 | EIF4B | EIF4B Entrez, Source | eukaryotic translation initiation factor 4B | 10193 | -0.081 | -0.4924 | Yes |
| 29 | ZNF96 | ZNF96 Entrez, Source | zinc finger protein 96 | 10854 | -0.105 | -0.5211 | Yes |
| 30 | RPS19 | RPS19 Entrez, Source | ribosomal protein S19 | 10892 | -0.106 | -0.5027 | Yes |
| 31 | RPL13A | RPL13A Entrez, Source | ribosomal protein L13a | 10925 | -0.108 | -0.4835 | Yes |
| 32 | LMNB1 | LMNB1 Entrez, Source | lamin B1 | 11329 | -0.128 | -0.4883 | Yes |
| 33 | BAIAP2 | BAIAP2 Entrez, Source | BAI1-associated protein 2 | 11565 | -0.141 | -0.4778 | Yes |
| 34 | EHMT2 | EHMT2 Entrez, Source | euchromatic histone-lysine N-methyltransferase 2 | 11568 | -0.141 | -0.4497 | Yes |
| 35 | POLD1 | POLD1 Entrez, Source | polymerase (DNA directed), delta 1, catalytic subunit 125kDa | 11672 | -0.148 | -0.4279 | Yes |
| 36 | EMP1 | EMP1 Entrez, Source | epithelial membrane protein 1 | 12100 | -0.181 | -0.4237 | Yes |
| 37 | PALMD | PALMD Entrez, Source | palmdelphin | 12567 | -0.238 | -0.4112 | Yes |
| 38 | ITGA6 | ITGA6 Entrez, Source | integrin, alpha 6 | 12719 | -0.269 | -0.3688 | Yes |
| 39 | SNN | SNN Entrez, Source | stannin | 12996 | -0.362 | -0.3173 | Yes |
| 40 | CD69 | CD69 Entrez, Source | CD69 molecule | 13130 | -0.450 | -0.2373 | Yes |
| 41 | FXYD5 | FXYD5 Entrez, Source | FXYD domain containing ion transport regulator 5 | 13147 | -0.472 | -0.1442 | Yes |
| 42 | NDRG1 | NDRG1 Entrez, Source | N-myc downstream regulated gene 1 | 13282 | -0.795 | 0.0045 | Yes |