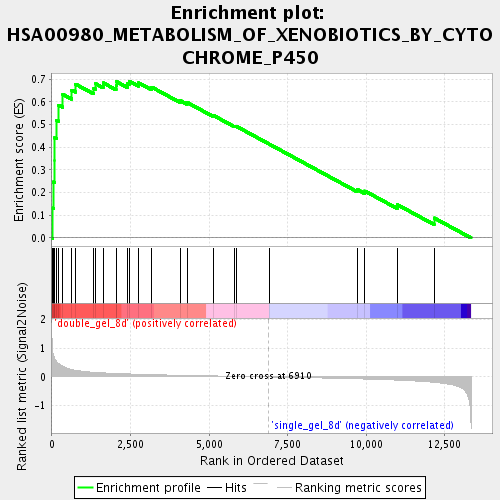
Profile of the Running ES Score & Positions of GeneSet Members on the Rank Ordered List
| Dataset | double_gel_and_single_gel_rma_expression_values_collapsed_to_symbols.class.cls #double_gel_8d_versus_single_gel_8d.class.cls #double_gel_8d_versus_single_gel_8d_repos |
| Phenotype | class.cls#double_gel_8d_versus_single_gel_8d_repos |
| Upregulated in class | double_gel_8d |
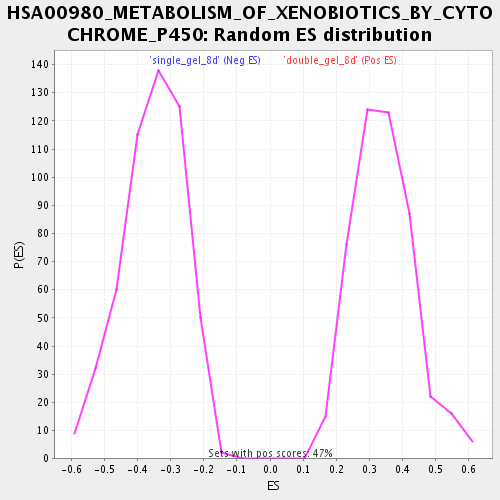
| GeneSet | HSA00980_METABOLISM_OF_XENOBIOTICS_BY_CYTOCHROME_P450 |
| Enrichment Score (ES) | 0.69181204 |
| Normalized Enrichment Score (NES) | 2.0269458 |
| Nominal p-value | 0.0 |
| FDR q-value | 0.0011598871 |
| FWER p-Value | 0.091 |
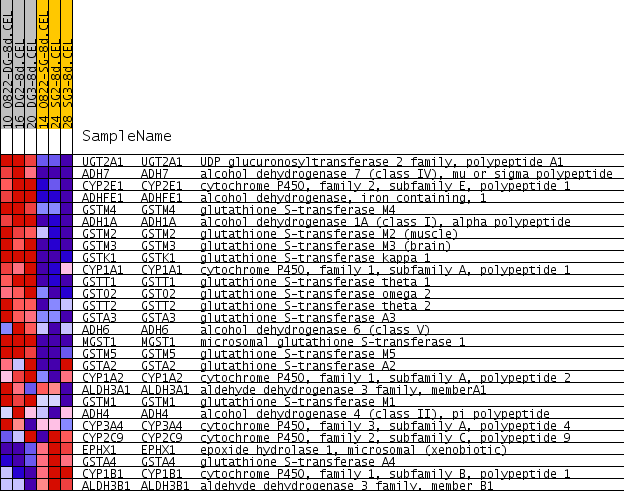
| PROBE | GENE SYMBOL | GENE_TITLE | RANK IN GENE LIST | RANK METRIC SCORE | RUNNING ES | CORE ENRICHMENT | |
|---|---|---|---|---|---|---|---|
| 1 | UGT2A1 | UGT2A1 Entrez, Source | UDP glucuronosyltransferase 2 family, polypeptide A1 | 25 | 0.863 | 0.1321 | Yes |
| 2 | ADH7 | ADH7 Entrez, Source | alcohol dehydrogenase 7 (class IV), mu or sigma polypeptide | 50 | 0.751 | 0.2469 | Yes |
| 3 | CYP2E1 | CYP2E1 Entrez, Source | cytochrome P450, family 2, subfamily E, polypeptide 1 | 87 | 0.637 | 0.3431 | Yes |
| 4 | ADHFE1 | ADHFE1 Entrez, Source | alcohol dehydrogenase, iron containing, 1 | 89 | 0.633 | 0.4413 | Yes |
| 5 | GSTM4 | GSTM4 Entrez, Source | glutathione S-transferase M4 | 151 | 0.530 | 0.5191 | Yes |
| 6 | ADH1A | ADH1A Entrez, Source | alcohol dehydrogenase 1A (class I), alpha polypeptide | 214 | 0.460 | 0.5859 | Yes |
| 7 | GSTM2 | GSTM2 Entrez, Source | glutathione S-transferase M2 (muscle) | 345 | 0.369 | 0.6335 | Yes |
| 8 | GSTM3 | GSTM3 Entrez, Source | glutathione S-transferase M3 (brain) | 630 | 0.258 | 0.6522 | Yes |
| 9 | GSTK1 | GSTK1 Entrez, Source | glutathione S-transferase kappa 1 | 752 | 0.227 | 0.6784 | Yes |
| 10 | CYP1A1 | CYP1A1 Entrez, Source | cytochrome P450, family 1, subfamily A, polypeptide 1 | 1331 | 0.162 | 0.6602 | Yes |
| 11 | GSTT1 | GSTT1 Entrez, Source | glutathione S-transferase theta 1 | 1394 | 0.157 | 0.6800 | Yes |
| 12 | GSTO2 | GSTO2 Entrez, Source | glutathione S-transferase omega 2 | 1634 | 0.141 | 0.6839 | Yes |
| 13 | GSTT2 | GSTT2 Entrez, Source | glutathione S-transferase theta 2 | 2044 | 0.120 | 0.6718 | Yes |
| 14 | GSTA3 | GSTA3 Entrez, Source | glutathione S-transferase A3 | 2058 | 0.119 | 0.6893 | Yes |
| 15 | ADH6 | ADH6 Entrez, Source | alcohol dehydrogenase 6 (class V) | 2402 | 0.107 | 0.6801 | Yes |
| 16 | MGST1 | MGST1 Entrez, Source | microsomal glutathione S-transferase 1 | 2463 | 0.104 | 0.6918 | Yes |
| 17 | GSTM5 | GSTM5 Entrez, Source | glutathione S-transferase M5 | 2762 | 0.093 | 0.6839 | No |
| 18 | GSTA2 | GSTA2 Entrez, Source | glutathione S-transferase A2 | 3173 | 0.079 | 0.6654 | No |
| 19 | CYP1A2 | CYP1A2 Entrez, Source | cytochrome P450, family 1, subfamily A, polypeptide 2 | 4085 | 0.058 | 0.6060 | No |
| 20 | ALDH3A1 | ALDH3A1 Entrez, Source | aldehyde dehydrogenase 3 family, memberA1 | 4305 | 0.053 | 0.5977 | No |
| 21 | GSTM1 | GSTM1 Entrez, Source | glutathione S-transferase M1 | 5136 | 0.035 | 0.5408 | No |
| 22 | ADH4 | ADH4 Entrez, Source | alcohol dehydrogenase 4 (class II), pi polypeptide | 5822 | 0.022 | 0.4927 | No |
| 23 | CYP3A4 | CYP3A4 Entrez, Source | cytochrome P450, family 3, subfamily A, polypeptide 4 | 5860 | 0.021 | 0.4932 | No |
| 24 | CYP2C9 | CYP2C9 Entrez, Source | cytochrome P450, family 2, subfamily C, polypeptide 9 | 6932 | -0.001 | 0.4129 | No |
| 25 | EPHX1 | EPHX1 Entrez, Source | epoxide hydrolase 1, microsomal (xenobiotic) | 9718 | -0.066 | 0.2139 | No |
| 26 | GSTA4 | GSTA4 Entrez, Source | glutathione S-transferase A4 | 9961 | -0.073 | 0.2071 | No |
| 27 | CYP1B1 | CYP1B1 Entrez, Source | cytochrome P450, family 1, subfamily B, polypeptide 1 | 11000 | -0.112 | 0.1465 | No |
| 28 | ALDH3B1 | ALDH3B1 Entrez, Source | aldehyde dehydrogenase 3 family, member B1 | 12169 | -0.189 | 0.0881 | No |