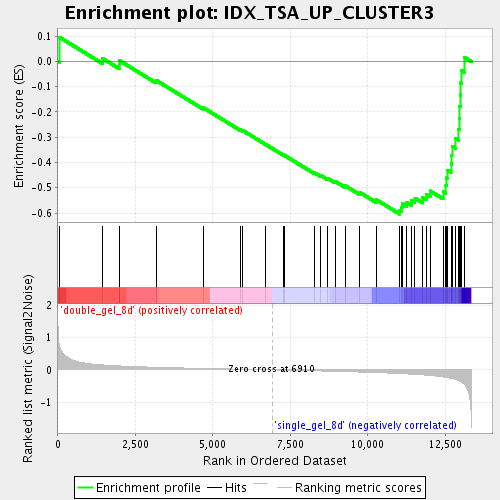
Profile of the Running ES Score & Positions of GeneSet Members on the Rank Ordered List
| Dataset | double_gel_and_single_gel_rma_expression_values_collapsed_to_symbols.class.cls #double_gel_8d_versus_single_gel_8d.class.cls #double_gel_8d_versus_single_gel_8d_repos |
| Phenotype | class.cls#double_gel_8d_versus_single_gel_8d_repos |
| Upregulated in class | single_gel_8d |
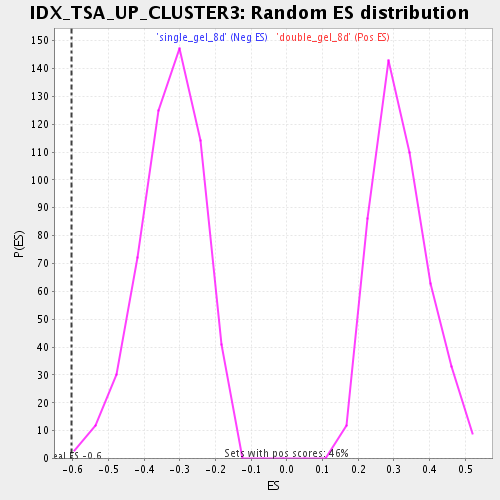
| GeneSet | IDX_TSA_UP_CLUSTER3 |
| Enrichment Score (ES) | -0.6043219 |
| Normalized Enrichment Score (NES) | -1.8556896 |
| Nominal p-value | 0.0018382353 |
| FDR q-value | 0.030246627 |
| FWER p-Value | 0.689 |
| PROBE | GENE SYMBOL | GENE_TITLE | RANK IN GENE LIST | RANK METRIC SCORE | RUNNING ES | CORE ENRICHMENT | |
|---|---|---|---|---|---|---|---|
| 1 | WNT4 | WNT4 Entrez, Source | wingless-type MMTV integration site family, member 4 | 51 | 0.748 | 0.0959 | No |
| 2 | IL13RA1 | IL13RA1 Entrez, Source | interleukin 13 receptor, alpha 1 | 1446 | 0.153 | 0.0116 | No |
| 3 | LMO4 | LMO4 Entrez, Source | LIM domain only 4 | 1984 | 0.122 | -0.0125 | No |
| 4 | PTGFR | PTGFR Entrez, Source | prostaglandin F receptor (FP) | 1990 | 0.122 | 0.0034 | No |
| 5 | CCNF | CCNF Entrez, Source | cyclin F | 3166 | 0.080 | -0.0743 | No |
| 6 | FIGNL1 | FIGNL1 Entrez, Source | fidgetin-like 1 | 4683 | 0.044 | -0.1824 | No |
| 7 | HGF | HGF Entrez, Source | hepatocyte growth factor (hepapoietin A; scatter factor) | 5893 | 0.020 | -0.2706 | No |
| 8 | E2F8 | E2F8 Entrez, Source | E2F transcription factor 8 | 5971 | 0.019 | -0.2738 | No |
| 9 | NQO1 | NQO1 Entrez, Source | NAD(P)H dehydrogenase, quinone 1 | 6707 | 0.004 | -0.3286 | No |
| 10 | IMPDH2 | IMPDH2 Entrez, Source | IMP (inosine monophosphate) dehydrogenase 2 | 7268 | -0.008 | -0.3696 | No |
| 11 | AQP1 | AQP1 Entrez, Source | aquaporin 1 (Colton blood group) | 7326 | -0.009 | -0.3728 | No |
| 12 | KIF4A | KIF4A Entrez, Source | kinesin family member 4A | 8274 | -0.029 | -0.4401 | No |
| 13 | GAS6 | GAS6 Entrez, Source | growth arrest-specific 6 | 8485 | -0.034 | -0.4513 | No |
| 14 | TUBB6 | TUBB6 Entrez, Source | tubulin, beta 6 | 8711 | -0.039 | -0.4630 | No |
| 15 | NASP | NASP Entrez, Source | nuclear autoantigenic sperm protein (histone-binding) | 8949 | -0.045 | -0.4749 | No |
| 16 | USP1 | USP1 Entrez, Source | ubiquitin specific peptidase 1 | 9270 | -0.054 | -0.4918 | No |
| 17 | BZW1 | BZW1 Entrez, Source | basic leucine zipper and W2 domains 1 | 9724 | -0.066 | -0.5171 | No |
| 18 | PLK1 | PLK1 Entrez, Source | polo-like kinase 1 (Drosophila) | 10276 | -0.084 | -0.5473 | No |
| 19 | CX3CL1 | CX3CL1 Entrez, Source | chemokine (C-X3-C motif) ligand 1 | 11035 | -0.114 | -0.5892 | Yes |
| 20 | CDC20 | CDC20 Entrez, Source | CDC20 cell division cycle 20 homolog (S. cerevisiae) | 11099 | -0.117 | -0.5783 | Yes |
| 21 | BIRC5 | BIRC5 Entrez, Source | baculoviral IAP repeat-containing 5 (survivin) | 11117 | -0.118 | -0.5639 | Yes |
| 22 | CDCA7 | CDCA7 Entrez, Source | cell division cycle associated 7 | 11253 | -0.124 | -0.5575 | Yes |
| 23 | DCK | DCK Entrez, Source | deoxycytidine kinase | 11406 | -0.131 | -0.5514 | Yes |
| 24 | BRCA1 | BRCA1 Entrez, Source | breast cancer 1, early onset | 11523 | -0.139 | -0.5417 | Yes |
| 25 | KLF5 | KLF5 Entrez, Source | Kruppel-like factor 5 (intestinal) | 11774 | -0.155 | -0.5398 | Yes |
| 26 | KIF2C | KIF2C Entrez, Source | kinesin family member 2C | 11889 | -0.164 | -0.5266 | Yes |
| 27 | TYMS | TYMS Entrez, Source | thymidylate synthetase | 12013 | -0.174 | -0.5126 | Yes |
| 28 | CSRP2 | CSRP2 Entrez, Source | cysteine and glycine-rich protein 2 | 12431 | -0.219 | -0.5148 | Yes |
| 29 | ABCA1 | ABCA1 Entrez, Source | ATP-binding cassette, sub-family A (ABC1), member 1 | 12519 | -0.231 | -0.4905 | Yes |
| 30 | AURKA | AURKA Entrez, Source | aurora kinase A | 12548 | -0.235 | -0.4612 | Yes |
| 31 | TCF19 | TCF19 Entrez, Source | transcription factor 19 (SC1) | 12573 | -0.239 | -0.4311 | Yes |
| 32 | TACC3 | TACC3 Entrez, Source | transforming, acidic coiled-coil containing protein 3 | 12687 | -0.262 | -0.4047 | Yes |
| 33 | KIF22 | KIF22 Entrez, Source | kinesin family member 22 | 12713 | -0.267 | -0.3710 | Yes |
| 34 | FEN1 | FEN1 Entrez, Source | flap structure-specific endonuclease 1 | 12720 | -0.269 | -0.3356 | Yes |
| 35 | TRIP13 | TRIP13 Entrez, Source | thyroid hormone receptor interactor 13 | 12822 | -0.294 | -0.3039 | Yes |
| 36 | CDCA8 | CDCA8 Entrez, Source | cell division cycle associated 8 | 12936 | -0.334 | -0.2679 | Yes |
| 37 | CCNB2 | CCNB2 Entrez, Source | cyclin B2 | 12954 | -0.340 | -0.2238 | Yes |
| 38 | SLCO3A1 | SLCO3A1 Entrez, Source | solute carrier organic anion transporter family, member 3A1 | 12964 | -0.345 | -0.1785 | Yes |
| 39 | CCNB1 | CCNB1 Entrez, Source | cyclin B1 | 12986 | -0.357 | -0.1325 | Yes |
| 40 | PRIM1 | PRIM1 Entrez, Source | primase, polypeptide 1, 49kDa | 12999 | -0.364 | -0.0848 | Yes |
| 41 | MCM7 | MCM7 Entrez, Source | MCM7 minichromosome maintenance deficient 7 (S. cerevisiae) | 13028 | -0.381 | -0.0362 | Yes |
| 42 | KIAA0101 | KIAA0101 Entrez, Source | KIAA0101 | 13128 | -0.448 | 0.0161 | Yes |