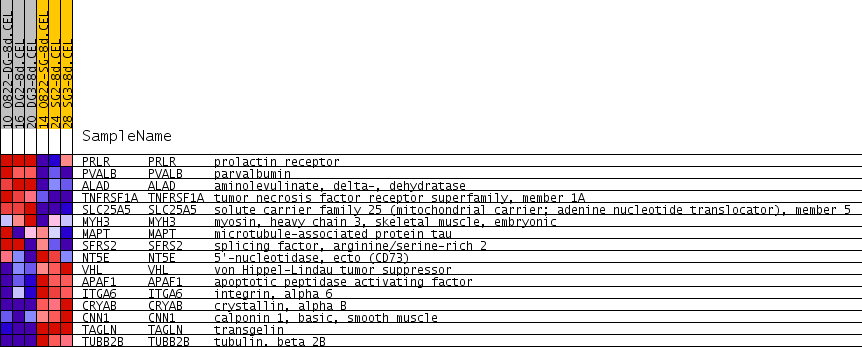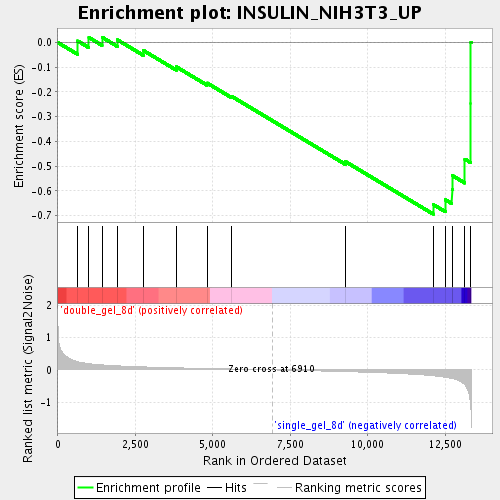
Profile of the Running ES Score & Positions of GeneSet Members on the Rank Ordered List
| Dataset | double_gel_and_single_gel_rma_expression_values_collapsed_to_symbols.class.cls #double_gel_8d_versus_single_gel_8d.class.cls #double_gel_8d_versus_single_gel_8d_repos |
| Phenotype | class.cls#double_gel_8d_versus_single_gel_8d_repos |
| Upregulated in class | single_gel_8d |
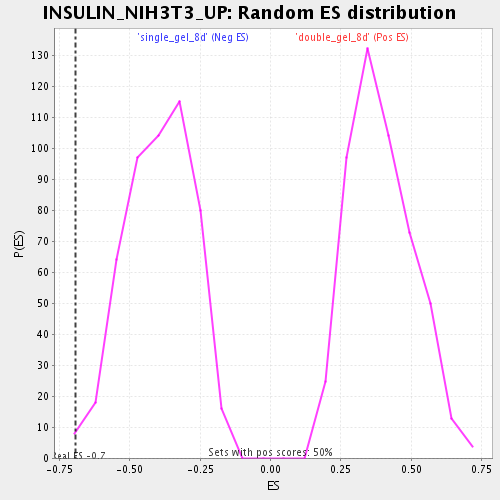
| GeneSet | INSULIN_NIH3T3_UP |
| Enrichment Score (ES) | -0.69439083 |
| Normalized Enrichment Score (NES) | -1.7487036 |
| Nominal p-value | 0.00996016 |
| FDR q-value | 0.06294586 |
| FWER p-Value | 0.994 |
| PROBE | GENE SYMBOL | GENE_TITLE | RANK IN GENE LIST | RANK METRIC SCORE | RUNNING ES | CORE ENRICHMENT | |
|---|---|---|---|---|---|---|---|
| 1 | PRLR | PRLR Entrez, Source | prolactin receptor | 638 | 0.256 | 0.0064 | No |
| 2 | PVALB | PVALB Entrez, Source | parvalbumin | 1001 | 0.193 | 0.0202 | No |
| 3 | ALAD | ALAD Entrez, Source | aminolevulinate, delta-, dehydratase | 1424 | 0.155 | 0.0215 | No |
| 4 | TNFRSF1A | TNFRSF1A Entrez, Source | tumor necrosis factor receptor superfamily, member 1A | 1920 | 0.125 | 0.0109 | No |
| 5 | SLC25A5 | SLC25A5 Entrez, Source | solute carrier family 25 (mitochondrial carrier; adenine nucleotide translocator), member 5 | 2756 | 0.094 | -0.0319 | No |
| 6 | MYH3 | MYH3 Entrez, Source | myosin, heavy chain 3, skeletal muscle, embryonic | 3820 | 0.064 | -0.0982 | No |
| 7 | MAPT | MAPT Entrez, Source | microtubule-associated protein tau | 4812 | 0.042 | -0.1637 | No |
| 8 | SFRS2 | SFRS2 Entrez, Source | splicing factor, arginine/serine-rich 2 | 5597 | 0.026 | -0.2171 | No |
| 9 | NT5E | NT5E Entrez, Source | 5'-nucleotidase, ecto (CD73) | 9276 | -0.054 | -0.4817 | No |
| 10 | VHL | VHL Entrez, Source | von Hippel-Lindau tumor suppressor | 12112 | -0.183 | -0.6557 | Yes |
| 11 | APAF1 | APAF1 Entrez, Source | apoptotic peptidase activating factor | 12510 | -0.230 | -0.6367 | Yes |
| 12 | ITGA6 | ITGA6 Entrez, Source | integrin, alpha 6 | 12719 | -0.269 | -0.5952 | Yes |
| 13 | CRYAB | CRYAB Entrez, Source | crystallin, alpha B | 12728 | -0.271 | -0.5383 | Yes |
| 14 | CNN1 | CNN1 Entrez, Source | calponin 1, basic, smooth muscle | 13134 | -0.456 | -0.4719 | Yes |
| 15 | TAGLN | TAGLN Entrez, Source | transgelin | 13326 | -1.131 | -0.2465 | Yes |
| 16 | TUBB2B | TUBB2B Entrez, Source | tubulin, beta 2B | 13328 | -1.168 | 0.0011 | Yes |