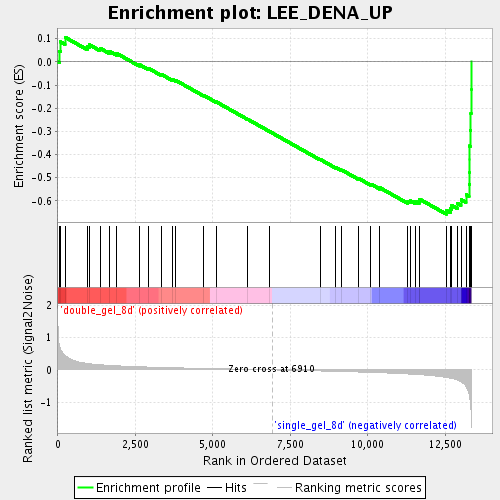
Profile of the Running ES Score & Positions of GeneSet Members on the Rank Ordered List
| Dataset | double_gel_and_single_gel_rma_expression_values_collapsed_to_symbols.class.cls #double_gel_8d_versus_single_gel_8d.class.cls #double_gel_8d_versus_single_gel_8d_repos |
| Phenotype | class.cls#double_gel_8d_versus_single_gel_8d_repos |
| Upregulated in class | single_gel_8d |
| GeneSet | LEE_DENA_UP |
| Enrichment Score (ES) | -0.6572623 |
| Normalized Enrichment Score (NES) | -2.0290084 |
| Nominal p-value | 0.0 |
| FDR q-value | 0.00689986 |
| FWER p-Value | 0.074 |
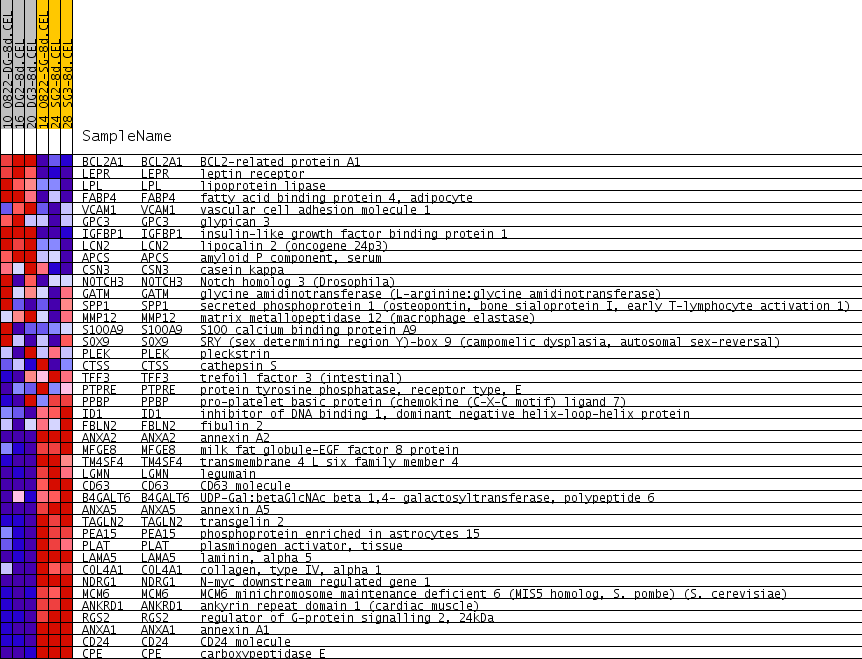
| PROBE | GENE SYMBOL | GENE_TITLE | RANK IN GENE LIST | RANK METRIC SCORE | RUNNING ES | CORE ENRICHMENT | |
|---|---|---|---|---|---|---|---|
| 1 | BCL2A1 | BCL2A1 Entrez, Source | BCL2-related protein A1 | 53 | 0.740 | 0.0460 | No |
| 2 | LEPR | LEPR Entrez, Source | leptin receptor | 85 | 0.639 | 0.0869 | No |
| 3 | LPL | LPL Entrez, Source | lipoprotein lipase | 230 | 0.451 | 0.1065 | No |
| 4 | FABP4 | FABP4 Entrez, Source | fatty acid binding protein 4, adipocyte | 947 | 0.200 | 0.0662 | No |
| 5 | VCAM1 | VCAM1 Entrez, Source | vascular cell adhesion molecule 1 | 1016 | 0.190 | 0.0740 | No |
| 6 | GPC3 | GPC3 Entrez, Source | glypican 3 | 1359 | 0.160 | 0.0591 | No |
| 7 | IGFBP1 | IGFBP1 Entrez, Source | insulin-like growth factor binding protein 1 | 1670 | 0.139 | 0.0452 | No |
| 8 | LCN2 | LCN2 Entrez, Source | lipocalin 2 (oncogene 24p3) | 1885 | 0.127 | 0.0377 | No |
| 9 | APCS | APCS Entrez, Source | amyloid P component, serum | 2625 | 0.098 | -0.0113 | No |
| 10 | CSN3 | CSN3 Entrez, Source | casein kappa | 2924 | 0.087 | -0.0278 | No |
| 11 | NOTCH3 | NOTCH3 Entrez, Source | Notch homolog 3 (Drosophila) | 3339 | 0.075 | -0.0538 | No |
| 12 | GATM | GATM Entrez, Source | glycine amidinotransferase (L-arginine:glycine amidinotransferase) | 3691 | 0.067 | -0.0757 | No |
| 13 | SPP1 | SPP1 Entrez, Source | secreted phosphoprotein 1 (osteopontin, bone sialoprotein I, early T-lymphocyte activation 1) | 3806 | 0.064 | -0.0800 | No |
| 14 | MMP12 | MMP12 Entrez, Source | matrix metallopeptidase 12 (macrophage elastase) | 4703 | 0.044 | -0.1444 | No |
| 15 | S100A9 | S100A9 Entrez, Source | S100 calcium binding protein A9 | 5107 | 0.036 | -0.1723 | No |
| 16 | SOX9 | SOX9 Entrez, Source | SRY (sex determining region Y)-box 9 (campomelic dysplasia, autosomal sex-reversal) | 6121 | 0.016 | -0.2474 | No |
| 17 | PLEK | PLEK Entrez, Source | pleckstrin | 6834 | 0.002 | -0.3008 | No |
| 18 | CTSS | CTSS Entrez, Source | cathepsin S | 8459 | -0.033 | -0.4206 | No |
| 19 | TFF3 | TFF3 Entrez, Source | trefoil factor 3 (intestinal) | 8966 | -0.045 | -0.4556 | No |
| 20 | PTPRE | PTPRE Entrez, Source | protein tyrosine phosphatase, receptor type, E | 9160 | -0.050 | -0.4667 | No |
| 21 | PPBP | PPBP Entrez, Source | pro-platelet basic protein (chemokine (C-X-C motif) ligand 7) | 9692 | -0.065 | -0.5023 | No |
| 22 | ID1 | ID1 Entrez, Source | inhibitor of DNA binding 1, dominant negative helix-loop-helix protein | 10098 | -0.078 | -0.5274 | No |
| 23 | FBLN2 | FBLN2 Entrez, Source | fibulin 2 | 10393 | -0.088 | -0.5436 | No |
| 24 | ANXA2 | ANXA2 Entrez, Source | annexin A2 | 11298 | -0.126 | -0.6030 | No |
| 25 | MFGE8 | MFGE8 Entrez, Source | milk fat globule-EGF factor 8 protein | 11372 | -0.130 | -0.5998 | No |
| 26 | TM4SF4 | TM4SF4 Entrez, Source | transmembrane 4 L six family member 4 | 11537 | -0.140 | -0.6027 | No |
| 27 | LGMN | LGMN Entrez, Source | legumain | 11659 | -0.148 | -0.6018 | No |
| 28 | CD63 | CD63 Entrez, Source | CD63 molecule | 11668 | -0.148 | -0.5924 | No |
| 29 | B4GALT6 | B4GALT6 Entrez, Source | UDP-Gal:betaGlcNAc beta 1,4- galactosyltransferase, polypeptide 6 | 12532 | -0.233 | -0.6415 | Yes |
| 30 | ANXA5 | ANXA5 Entrez, Source | annexin A5 | 12668 | -0.258 | -0.6342 | Yes |
| 31 | TAGLN2 | TAGLN2 Entrez, Source | transgelin 2 | 12708 | -0.266 | -0.6192 | Yes |
| 32 | PEA15 | PEA15 Entrez, Source | phosphoprotein enriched in astrocytes 15 | 12899 | -0.321 | -0.6118 | Yes |
| 33 | PLAT | PLAT Entrez, Source | plasminogen activator, tissue | 13010 | -0.371 | -0.5950 | Yes |
| 34 | LAMA5 | LAMA5 Entrez, Source | laminin, alpha 5 | 13171 | -0.510 | -0.5726 | Yes |
| 35 | COL4A1 | COL4A1 Entrez, Source | collagen, type IV, alpha 1 | 13269 | -0.760 | -0.5285 | Yes |
| 36 | NDRG1 | NDRG1 Entrez, Source | N-myc downstream regulated gene 1 | 13282 | -0.795 | -0.4757 | Yes |
| 37 | MCM6 | MCM6 Entrez, Source | MCM6 minichromosome maintenance deficient 6 (MIS5 homolog, S. pombe) (S. cerevisiae) | 13289 | -0.828 | -0.4202 | Yes |
| 38 | ANKRD1 | ANKRD1 Entrez, Source | ankyrin repeat domain 1 (cardiac muscle) | 13290 | -0.848 | -0.3629 | Yes |
| 39 | RGS2 | RGS2 Entrez, Source | regulator of G-protein signalling 2, 24kDa | 13309 | -0.997 | -0.2969 | Yes |
| 40 | ANXA1 | ANXA1 Entrez, Source | annexin A1 | 13327 | -1.146 | -0.2208 | Yes |
| 41 | CD24 | CD24 Entrez, Source | CD24 molecule | 13337 | -1.491 | -0.1207 | Yes |
| 42 | CPE | CPE Entrez, Source | carboxypeptidase E | 13342 | -1.792 | -0.0000 | Yes |