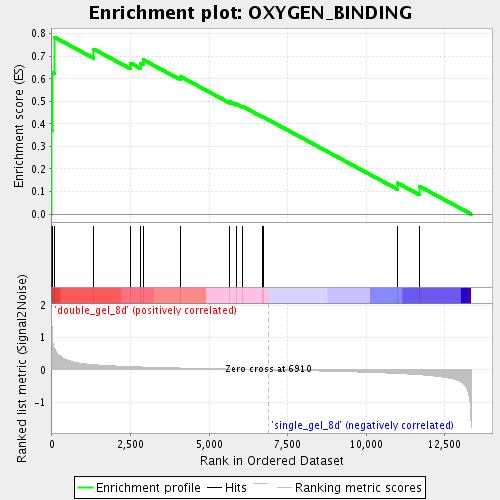
Profile of the Running ES Score & Positions of GeneSet Members on the Rank Ordered List
| Dataset | double_gel_and_single_gel_rma_expression_values_collapsed_to_symbols.class.cls #double_gel_8d_versus_single_gel_8d.class.cls #double_gel_8d_versus_single_gel_8d_repos |
| Phenotype | class.cls#double_gel_8d_versus_single_gel_8d_repos |
| Upregulated in class | double_gel_8d |
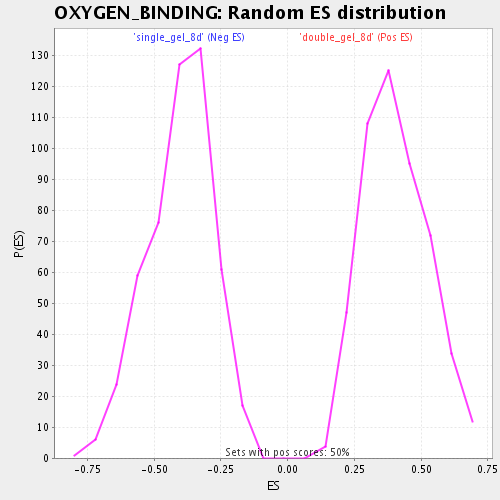
| GeneSet | OXYGEN_BINDING |
| Enrichment Score (ES) | 0.7841669 |
| Normalized Enrichment Score (NES) | 1.9385632 |
| Nominal p-value | 0.0 |
| FDR q-value | 0.00350777 |
| FWER p-Value | 0.292 |
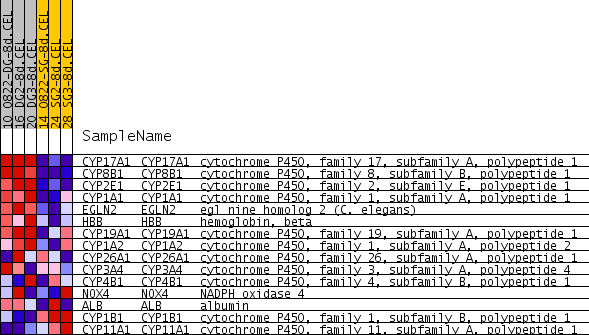
| PROBE | GENE SYMBOL | GENE_TITLE | RANK IN GENE LIST | RANK METRIC SCORE | RUNNING ES | CORE ENRICHMENT | |
|---|---|---|---|---|---|---|---|
| 1 | CYP17A1 | CYP17A1 Entrez, Source | cytochrome P450, family 17, subfamily A, polypeptide 1 | 1 | 1.475 | 0.3711 | Yes |
| 2 | CYP8B1 | CYP8B1 Entrez, Source | cytochrome P450, family 8, subfamily B, polypeptide 1 | 14 | 1.030 | 0.6294 | Yes |
| 3 | CYP2E1 | CYP2E1 Entrez, Source | cytochrome P450, family 2, subfamily E, polypeptide 1 | 87 | 0.637 | 0.7842 | Yes |
| 4 | CYP1A1 | CYP1A1 Entrez, Source | cytochrome P450, family 1, subfamily A, polypeptide 1 | 1331 | 0.162 | 0.7317 | No |
| 5 | EGLN2 | EGLN2 Entrez, Source | egl nine homolog 2 (C. elegans) | 2499 | 0.103 | 0.6699 | No |
| 6 | HBB | HBB Entrez, Source | hemoglobin, beta | 2826 | 0.091 | 0.6682 | No |
| 7 | CYP19A1 | CYP19A1 Entrez, Source | cytochrome P450, family 19, subfamily A, polypeptide 1 | 2909 | 0.088 | 0.6842 | No |
| 8 | CYP1A2 | CYP1A2 Entrez, Source | cytochrome P450, family 1, subfamily A, polypeptide 2 | 4085 | 0.058 | 0.6105 | No |
| 9 | CYP26A1 | CYP26A1 Entrez, Source | cytochrome P450, family 26, subfamily A, polypeptide 1 | 5664 | 0.024 | 0.4982 | No |
| 10 | CYP3A4 | CYP3A4 Entrez, Source | cytochrome P450, family 3, subfamily A, polypeptide 4 | 5860 | 0.021 | 0.4889 | No |
| 11 | CYP4B1 | CYP4B1 Entrez, Source | cytochrome P450, family 4, subfamily B, polypeptide 1 | 6055 | 0.017 | 0.4787 | No |
| 12 | NOX4 | NOX4 Entrez, Source | NADPH oxidase 4 | 6694 | 0.004 | 0.4319 | No |
| 13 | ALB | ALB Entrez, Source | albumin | 6739 | 0.004 | 0.4295 | No |
| 14 | CYP1B1 | CYP1B1 Entrez, Source | cytochrome P450, family 1, subfamily B, polypeptide 1 | 11000 | -0.112 | 0.1379 | No |
| 15 | CYP11A1 | CYP11A1 Entrez, Source | cytochrome P450, family 11, subfamily A, polypeptide 1 | 11705 | -0.150 | 0.1228 | No |