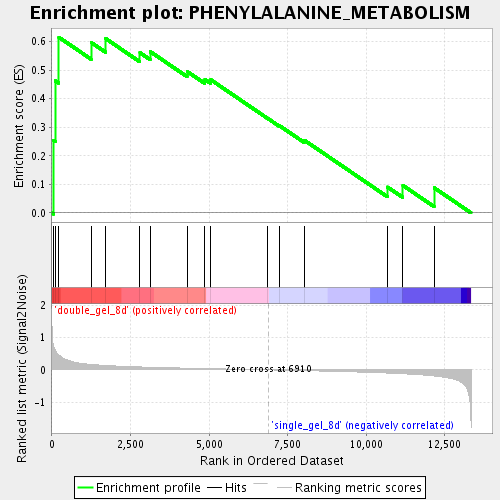
Profile of the Running ES Score & Positions of GeneSet Members on the Rank Ordered List
| Dataset | double_gel_and_single_gel_rma_expression_values_collapsed_to_symbols.class.cls #double_gel_8d_versus_single_gel_8d.class.cls #double_gel_8d_versus_single_gel_8d_repos |
| Phenotype | class.cls#double_gel_8d_versus_single_gel_8d_repos |
| Upregulated in class | double_gel_8d |
| GeneSet | PHENYLALANINE_METABOLISM |
| Enrichment Score (ES) | 0.6154675 |
| Normalized Enrichment Score (NES) | 1.5411043 |
| Nominal p-value | 0.04524887 |
| FDR q-value | 0.09932889 |
| FWER p-Value | 1.0 |
| PROBE | GENE SYMBOL | GENE_TITLE | RANK IN GENE LIST | RANK METRIC SCORE | RUNNING ES | CORE ENRICHMENT | |
|---|---|---|---|---|---|---|---|
| 1 | GOT1 | GOT1 Entrez, Source | glutamic-oxaloacetic transaminase 1, soluble (aspartate aminotransferase 1) | 56 | 0.731 | 0.2533 | Yes |
| 2 | ABP1 | ABP1 Entrez, Source | amiloride binding protein 1 (amine oxidase (copper-containing)) | 109 | 0.606 | 0.4629 | Yes |
| 3 | TAT | TAT Entrez, Source | tyrosine aminotransferase | 221 | 0.457 | 0.6155 | Yes |
| 4 | HPD | HPD Entrez, Source | 4-hydroxyphenylpyruvate dioxygenase | 1252 | 0.167 | 0.5971 | No |
| 5 | MAOB | MAOB Entrez, Source | monoamine oxidase B | 1712 | 0.137 | 0.6107 | No |
| 6 | MAOA | MAOA Entrez, Source | monoamine oxidase A | 2802 | 0.091 | 0.5612 | No |
| 7 | DDC | DDC Entrez, Source | dopa decarboxylase (aromatic L-amino acid decarboxylase) | 3130 | 0.081 | 0.5651 | No |
| 8 | ALDH3A1 | ALDH3A1 Entrez, Source | aldehyde dehydrogenase 3 family, memberA1 | 4305 | 0.053 | 0.4956 | No |
| 9 | AOC3 | AOC3 Entrez, Source | amine oxidase, copper containing 3 (vascular adhesion protein 1) | 4870 | 0.040 | 0.4675 | No |
| 10 | PRDX5 | PRDX5 Entrez, Source | peroxiredoxin 5 | 5059 | 0.037 | 0.4664 | No |
| 11 | PRDX6 | PRDX6 Entrez, Source | peroxiredoxin 6 | 6850 | 0.001 | 0.3326 | No |
| 12 | GOT2 | GOT2 Entrez, Source | glutamic-oxaloacetic transaminase 2, mitochondrial (aspartate aminotransferase 2) | 7234 | -0.007 | 0.3063 | No |
| 13 | TPO | TPO Entrez, Source | thyroid peroxidase | 8032 | -0.024 | 0.2550 | No |
| 14 | PRDX1 | PRDX1 Entrez, Source | peroxiredoxin 1 | 10681 | -0.098 | 0.0908 | No |
| 15 | PRDX2 | PRDX2 Entrez, Source | peroxiredoxin 2 | 11173 | -0.120 | 0.0962 | No |
| 16 | ALDH3B1 | ALDH3B1 Entrez, Source | aldehyde dehydrogenase 3 family, member B1 | 12169 | -0.189 | 0.0880 | No |

