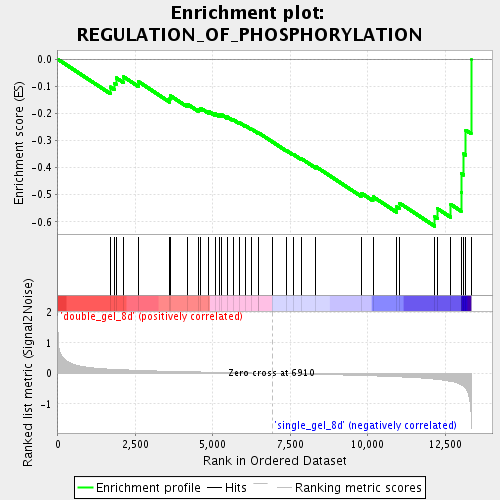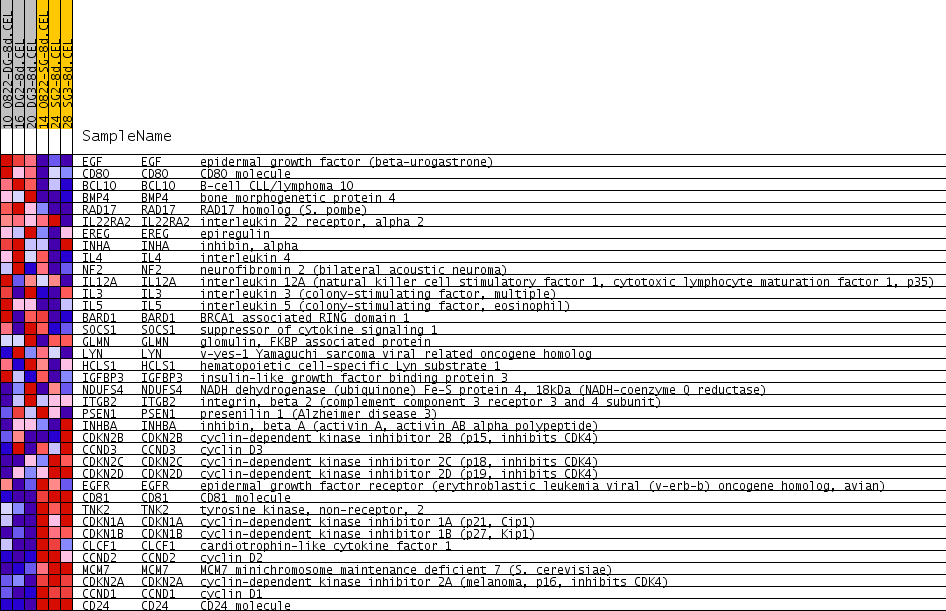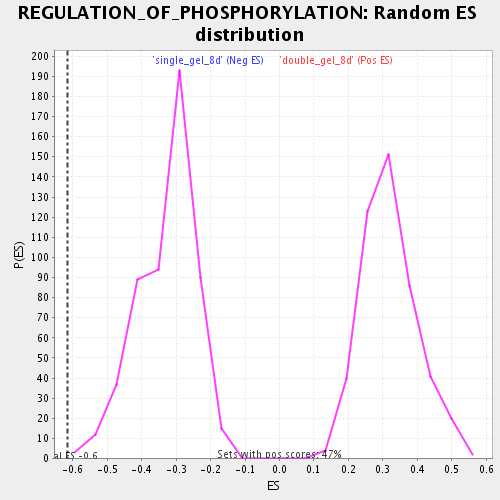
Profile of the Running ES Score & Positions of GeneSet Members on the Rank Ordered List
| Dataset | double_gel_and_single_gel_rma_expression_values_collapsed_to_symbols.class.cls #double_gel_8d_versus_single_gel_8d.class.cls #double_gel_8d_versus_single_gel_8d_repos |
| Phenotype | class.cls#double_gel_8d_versus_single_gel_8d_repos |
| Upregulated in class | single_gel_8d |
| GeneSet | REGULATION_OF_PHOSPHORYLATION |
| Enrichment Score (ES) | -0.6161116 |
| Normalized Enrichment Score (NES) | -1.8753638 |
| Nominal p-value | 0.0018761726 |
| FDR q-value | 0.025811465 |
| FWER p-Value | 0.593 |

| PROBE | GENE SYMBOL | GENE_TITLE | RANK IN GENE LIST | RANK METRIC SCORE | RUNNING ES | CORE ENRICHMENT | |
|---|---|---|---|---|---|---|---|
| 1 | EGF | EGF Entrez, Source | epidermal growth factor (beta-urogastrone) | 1695 | 0.137 | -0.1021 | No |
| 2 | CD80 | CD80 Entrez, Source | CD80 molecule | 1824 | 0.130 | -0.0877 | No |
| 3 | BCL10 | BCL10 Entrez, Source | B-cell CLL/lymphoma 10 | 1881 | 0.127 | -0.0685 | No |
| 4 | BMP4 | BMP4 Entrez, Source | bone morphogenetic protein 4 | 2116 | 0.117 | -0.0645 | No |
| 5 | RAD17 | RAD17 Entrez, Source | RAD17 homolog (S. pombe) | 2601 | 0.099 | -0.0826 | No |
| 6 | IL22RA2 | IL22RA2 Entrez, Source | interleukin 22 receptor, alpha 2 | 3612 | 0.068 | -0.1459 | No |
| 7 | EREG | EREG Entrez, Source | epiregulin | 3625 | 0.068 | -0.1342 | No |
| 8 | INHA | INHA Entrez, Source | inhibin, alpha | 4183 | 0.055 | -0.1659 | No |
| 9 | IL4 | IL4 Entrez, Source | interleukin 4 | 4550 | 0.047 | -0.1846 | No |
| 10 | NF2 | NF2 Entrez, Source | neurofibromin 2 (bilateral acoustic neuroma) | 4606 | 0.046 | -0.1802 | No |
| 11 | IL12A | IL12A Entrez, Source | interleukin 12A (natural killer cell stimulatory factor 1, cytotoxic lymphocyte maturation factor 1, p35) | 4872 | 0.040 | -0.1927 | No |
| 12 | IL3 | IL3 Entrez, Source | interleukin 3 (colony-stimulating factor, multiple) | 5075 | 0.036 | -0.2012 | No |
| 13 | IL5 | IL5 Entrez, Source | interleukin 5 (colony-stimulating factor, eosinophil) | 5207 | 0.034 | -0.2048 | No |
| 14 | BARD1 | BARD1 Entrez, Source | BRCA1 associated RING domain 1 | 5278 | 0.032 | -0.2041 | No |
| 15 | SOCS1 | SOCS1 Entrez, Source | suppressor of cytokine signaling 1 | 5462 | 0.029 | -0.2125 | No |
| 16 | GLMN | GLMN Entrez, Source | glomulin, FKBP associated protein | 5660 | 0.024 | -0.2229 | No |
| 17 | LYN | LYN Entrez, Source | v-yes-1 Yamaguchi sarcoma viral related oncogene homolog | 5855 | 0.021 | -0.2335 | No |
| 18 | HCLS1 | HCLS1 Entrez, Source | hematopoietic cell-specific Lyn substrate 1 | 6043 | 0.017 | -0.2444 | No |
| 19 | IGFBP3 | IGFBP3 Entrez, Source | insulin-like growth factor binding protein 3 | 6247 | 0.013 | -0.2572 | No |
| 20 | NDUFS4 | NDUFS4 Entrez, Source | NADH dehydrogenase (ubiquinone) Fe-S protein 4, 18kDa (NADH-coenzyme Q reductase) | 6477 | 0.008 | -0.2729 | No |
| 21 | ITGB2 | ITGB2 Entrez, Source | integrin, beta 2 (complement component 3 receptor 3 and 4 subunit) | 6482 | 0.008 | -0.2717 | No |
| 22 | PSEN1 | PSEN1 Entrez, Source | presenilin 1 (Alzheimer disease 3) | 6918 | -0.000 | -0.3044 | No |
| 23 | INHBA | INHBA Entrez, Source | inhibin, beta A (activin A, activin AB alpha polypeptide) | 7375 | -0.010 | -0.3369 | No |
| 24 | CDKN2B | CDKN2B Entrez, Source | cyclin-dependent kinase inhibitor 2B (p15, inhibits CDK4) | 7589 | -0.014 | -0.3502 | No |
| 25 | CCND3 | CCND3 Entrez, Source | cyclin D3 | 7859 | -0.020 | -0.3668 | No |
| 26 | CDKN2C | CDKN2C Entrez, Source | cyclin-dependent kinase inhibitor 2C (p18, inhibits CDK4) | 8322 | -0.030 | -0.3959 | No |
| 27 | CDKN2D | CDKN2D Entrez, Source | cyclin-dependent kinase inhibitor 2D (p19, inhibits CDK4) | 9788 | -0.068 | -0.4935 | No |
| 28 | EGFR | EGFR Entrez, Source | epidermal growth factor receptor (erythroblastic leukemia viral (v-erb-b) oncogene homolog, avian) | 10171 | -0.080 | -0.5074 | No |
| 29 | CD81 | CD81 Entrez, Source | CD81 molecule | 10933 | -0.108 | -0.5447 | No |
| 30 | TNK2 | TNK2 Entrez, Source | tyrosine kinase, non-receptor, 2 | 11023 | -0.113 | -0.5305 | No |
| 31 | CDKN1A | CDKN1A Entrez, Source | cyclin-dependent kinase inhibitor 1A (p21, Cip1) | 12163 | -0.188 | -0.5815 | Yes |
| 32 | CDKN1B | CDKN1B Entrez, Source | cyclin-dependent kinase inhibitor 1B (p27, Kip1) | 12251 | -0.199 | -0.5513 | Yes |
| 33 | CLCF1 | CLCF1 Entrez, Source | cardiotrophin-like cytokine factor 1 | 12679 | -0.260 | -0.5354 | Yes |
| 34 | CCND2 | CCND2 Entrez, Source | cyclin D2 | 13016 | -0.374 | -0.4916 | Yes |
| 35 | MCM7 | MCM7 Entrez, Source | MCM7 minichromosome maintenance deficient 7 (S. cerevisiae) | 13028 | -0.381 | -0.4222 | Yes |
| 36 | CDKN2A | CDKN2A Entrez, Source | cyclin-dependent kinase inhibitor 2A (melanoma, p16, inhibits CDK4) | 13099 | -0.425 | -0.3491 | Yes |
| 37 | CCND1 | CCND1 Entrez, Source | cyclin D1 | 13162 | -0.500 | -0.2616 | Yes |
| 38 | CD24 | CD24 Entrez, Source | CD24 molecule | 13337 | -1.491 | 0.0004 | Yes |

