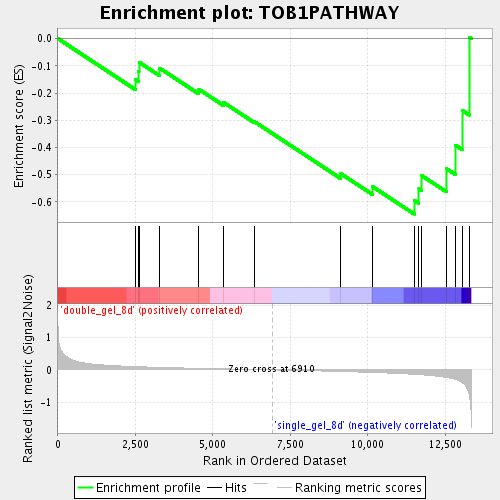
Profile of the Running ES Score & Positions of GeneSet Members on the Rank Ordered List
| Dataset | double_gel_and_single_gel_rma_expression_values_collapsed_to_symbols.class.cls #double_gel_8d_versus_single_gel_8d.class.cls #double_gel_8d_versus_single_gel_8d_repos |
| Phenotype | class.cls#double_gel_8d_versus_single_gel_8d_repos |
| Upregulated in class | single_gel_8d |
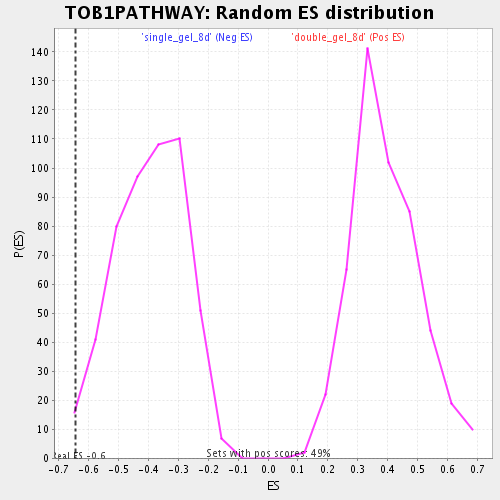
| GeneSet | TOB1PATHWAY |
| Enrichment Score (ES) | -0.6448026 |
| Normalized Enrichment Score (NES) | -1.6241918 |
| Nominal p-value | 0.011764706 |
| FDR q-value | 0.106648065 |
| FWER p-Value | 1.0 |
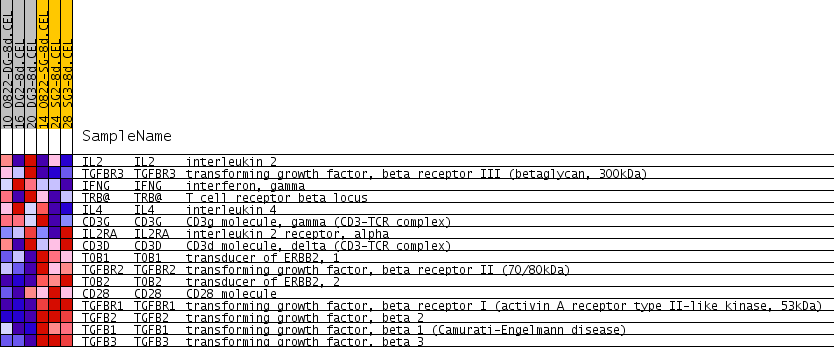
| PROBE | GENE SYMBOL | GENE_TITLE | RANK IN GENE LIST | RANK METRIC SCORE | RUNNING ES | CORE ENRICHMENT | |
|---|---|---|---|---|---|---|---|
| 1 | IL2 | IL2 Entrez, Source | interleukin 2 | 2505 | 0.102 | -0.1506 | No |
| 2 | TGFBR3 | TGFBR3 Entrez, Source | transforming growth factor, beta receptor III (betaglycan, 300kDa) | 2590 | 0.100 | -0.1206 | No |
| 3 | IFNG | IFNG Entrez, Source | interferon, gamma | 2618 | 0.098 | -0.0867 | No |
| 4 | TRB@ | TRB@ Entrez, Source | T cell receptor beta locus | 3282 | 0.076 | -0.1085 | No |
| 5 | IL4 | IL4 Entrez, Source | interleukin 4 | 4550 | 0.047 | -0.1863 | No |
| 6 | CD3G | CD3G Entrez, Source | CD3g molecule, gamma (CD3-TCR complex) | 5346 | 0.031 | -0.2346 | No |
| 7 | IL2RA | IL2RA Entrez, Source | interleukin 2 receptor, alpha | 6339 | 0.011 | -0.3050 | No |
| 8 | CD3D | CD3D Entrez, Source | CD3d molecule, delta (CD3-TCR complex) | 9132 | -0.050 | -0.4964 | No |
| 9 | TOB1 | TOB1 Entrez, Source | transducer of ERBB2, 1 | 10157 | -0.080 | -0.5440 | No |
| 10 | TGFBR2 | TGFBR2 Entrez, Source | transforming growth factor, beta receptor II (70/80kDa) | 11501 | -0.137 | -0.5946 | Yes |
| 11 | TOB2 | TOB2 Entrez, Source | transducer of ERBB2, 2 | 11652 | -0.147 | -0.5522 | Yes |
| 12 | CD28 | CD28 Entrez, Source | CD28 molecule | 11745 | -0.152 | -0.5037 | Yes |
| 13 | TGFBR1 | TGFBR1 Entrez, Source | transforming growth factor, beta receptor I (activin A receptor type II-like kinase, 53kDa) | 12538 | -0.234 | -0.4777 | Yes |
| 14 | TGFB2 | TGFB2 Entrez, Source | transforming growth factor, beta 2 | 12832 | -0.296 | -0.3918 | Yes |
| 15 | TGFB1 | TGFB1 Entrez, Source | transforming growth factor, beta 1 (Camurati-Engelmann disease) | 13047 | -0.395 | -0.2638 | Yes |
| 16 | TGFB3 | TGFB3 Entrez, Source | transforming growth factor, beta 3 | 13277 | -0.783 | 0.0049 | Yes |