CS 3824: Assignment 3
This assignment deals with the Gene Ontology (GO) and assessment of the state of experimental knowledge of gene function.
1. Parse the GO structure
Write code to parse the Gene Ontology file in OBO format. This format specifies the structure of each GO term and its relationships to other terms. For this step, you can use the goatools Python package, so there should not be much code for you to write. However, the documentation for this package does not exist, so you will have to poke around the library to see what functions to use. An alternative is to roll your own parser. It should not be difficult. Opening the GO file in a text editor, you will see that each GO term starts with a line that says [Term] followed by lines that specify additional information on the term.
- Create a class or appropriate data structure to store the information for each GO term (its id, name, and namespace).
- Each GO term can be a node in a directed graph (a networkx
DiGraph). - Each edge in this graph will correspond to an
is_aor apart_ofrelationship; these relationships appear at the end of the lines for the term. You can ignore other relationships.- An
is_arelationship will appear like this:is_a: GO:1902494 ! catalytic complex - A
part_ofrelationship will appear like this:relationship: part_of GO:0005829 ! cytosol - You need to parse out only the relationship type and the GO id.
- You can ignore other relationships.
- An
The function you write should return a DiGraph object (or equivalent class depending on which package you use for storing a graph). Let us call this object go_dag.
2. Parse the GO annotations file
Now write code to parse the GO annotations file for an organism. Once you again, you may be able to use the goatools package but I suggest you roll your own function. The files follow the GAF 2.2. format. You have seen this format in your readings for the lectures on gene function prediction. The key columns to parse in each line are DB Object ID, Qualifier, GO ID, Evidence Code, and Aspect. You can think of DB Object ID as a synonym for Gene ID. Note that there may be multiple lines for each (Gene ID, GO ID, Evidence Code) combination. You need to store each combination only once. Think about a good data structure for storing this information. What are the ways in which you will have to access this information efficiently for later parts of this assignment? If the Qualifier value in a row is NOT, ignore this row.
Parse GO annotations file for human (unzipped version, annotations only for ACE2). Call the corresponding data structure human_annotations.
3. Transfer annotations up the GO directed acyclic graph
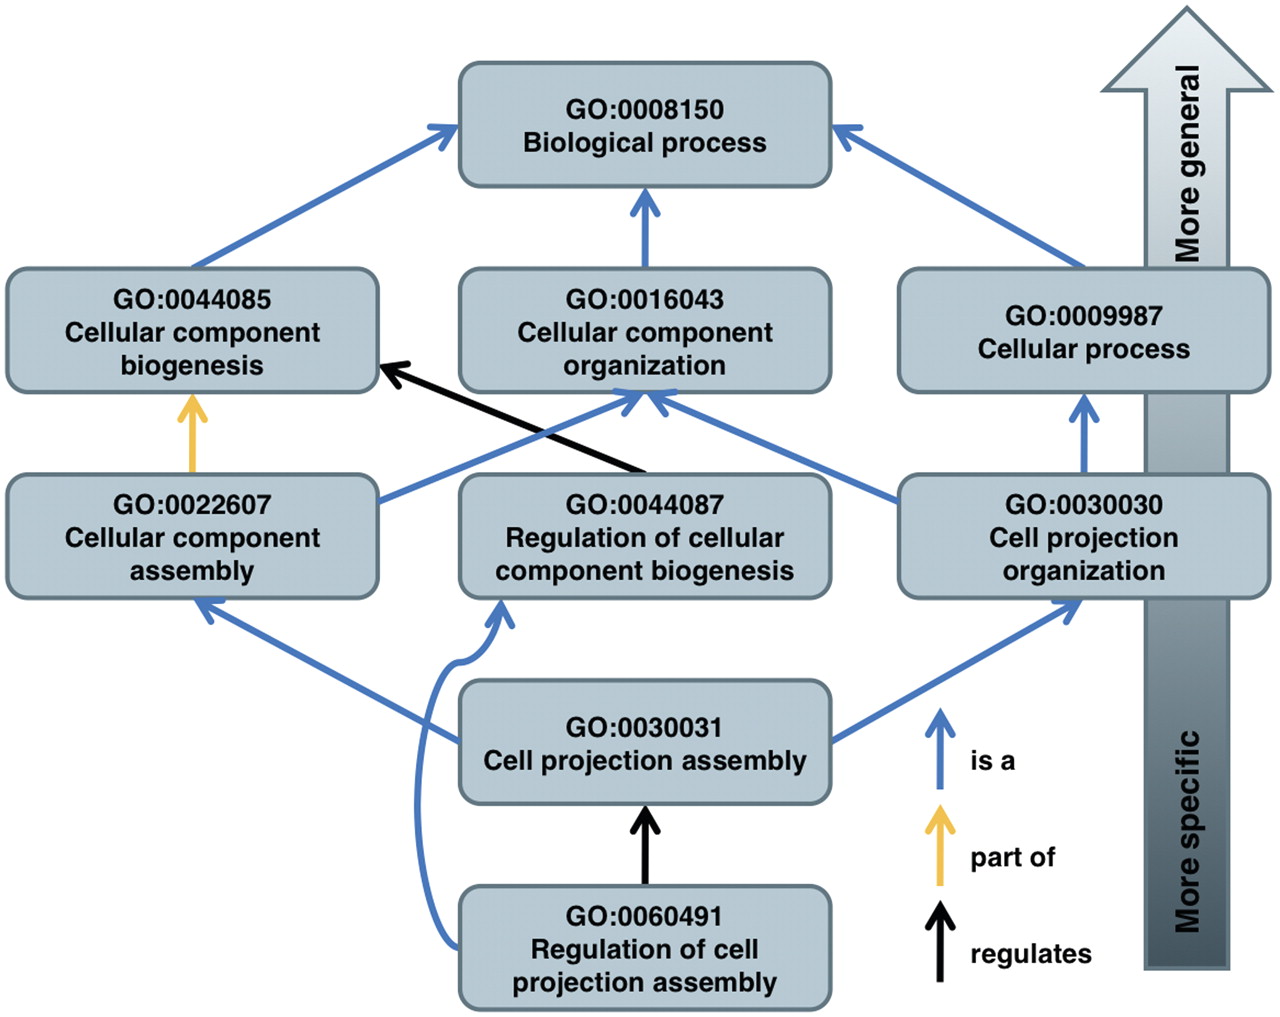
Suppose a term \(t\) is related to another term \(u\) by an is_a or a part_of relationship. We will say that \(u\) is a parent of \(t\). Informally, \(u\) is a less specific GO term than \(t\). In the figure, GO:0044085 (Cellular component biogenesis) is a parent of GO:0022607 (Cellular component assembly) but not of GO:0044087 (Regulation of cellular component biogenesis).
We generalise the notion of parent to an ancestor as follows: a term \(u\) is an ancestor of a term \(t\) either if \(u\) equals \(t\) or if there is a term \(v\) such that \(v\) is an ancestor of \(t\) and \(u\) is a parent of \(v\). By this definition (considering only the terms in the figure), GO:0060491 (Regulation of cell projection assembly) has only one ancestor, namely GO:0044087 (Regulation of cellular component biogenesis). In contrast, GO:0030031 (Cell projection assembly) has six ancestors. Can you see them all?
Here you will augment the GO annotations you have read in Part 2 using the following steps:
- For every GO term \(t\) in
go_dag, compute its set of ancestors \(A(t)\). There is anetworkxfunction that allows you to compute the set of ancestors easily. Store this information in anotherDiGraph. - For every GO term \(t\), for every ancestor \(a\) of \(t\), and for every gene \(g\) that is annotated to \(t\) in
human_annotations, create an annotation between \(g\) and \(a\) with the evidence codes associated with the pair \((g, t)\). For this step, for any GO term, you will need to efficiently determine which genes are annotated to it and what the evidence codes are for each annotation. This consideration will affect the data structure for Part 2.
Store this information in a data structure human_annotations_transferred similar to what you created for Part 2.
4. Find the most specific GO terms
For two thresholds (1% and 10%), find the most specific GO terms that annotate at least that percentage of genes. Let me explain what this sentence means.
- For each aspect (biological process, molecular function, cellular component), count the number of genes annotated by the root term in that aspect. This information is in
human_annotations_transferred(How will you find these root terms usinggo_dag?) Let these numbers be \(n_{bp}\), \(n_{mf}\), and \(n_{cc}\), respectively. - Consider the biological process aspect. Using
go_dagandhuman_annotations_transferred, find all the GO terms in this namespace that annotate at least \(n_{bp}/100\) genes, i.e., 1% of the genes. Let this set of terms be \(S\). - Now compute a subset \(T\) of the most specific terms in \(S\). I will define the most specific terms by exclusion: If a term \(u\) in \(S\) is an ancestor of a term \(t\) that is also in \(S\), do not include \(u\) in \(T\). Retain every term in \(S\) that fails this test in \(T\). As an example, if \(S\) contains all the terms in the figure, then \(T\) will contain only GO:0030031 and GO:0060491.
- Repeat this process for the other two namespaces.
- Repeat these steps with all three namespaces for the threshold of 10%. At the end of these steps, you will have four groups of GO terms.
5. Visualize the usage of evidence code groups
We now come to the crux of this assignment.
- Group the evidence codes into six sets, loosely following the Guide to GO Evidence Codes.
- EXP made up of the codes EXP, IDA, IPI, IMP, IGI, and IEP.
- HTP made up of the codes HTP, HDA, HMP, HGI, amd HEP.
- PHYLO made up of the codes IBA, IBD, IKR, and IRD.
- COMP made up of the codes ISS, ISO, ISA, ISM, IGC, and RCA.
- AUTH made up of the codes TAS, NAS, and IC
- IEA made up of the code IEA.
- ND made up of the code ND.
- For the biological process namespace with the 1% threshold, consider the set \(T\) of terms you computed in Part 4.
- Compute the union of the genes annotated by the terms in \(T\). Let this set of genes be \(G\).
- Partition the genes in \(G\) into seven groups using the following rules. A gene belongs to the EXP group if it is annotated to at least one term in \(T\) with an evidence code in the EXP set. Otherwise, the gene belongs to the HTP group if it is annotated to at least one term in \(T\) with an evidence code in the HTP set. Otherwise, the gene belongs to the PHYLO group if it is annotated to at least one term in \(T\) with an evidence code in the PHYLO set. And so on. Note that some groups may be empty.
- Repeat this process for the other two namespaces with the 1% threshold.
- Create three stacked bar charts (all on one plot) like the one titled "Number of annotations by evidence" at the bottom of http://geneontology.org/stats.html. Each stacked bar chart should show the number of genes that fall into each of the seven groups EXP, HTP, PHYLO, COMP, AUTH, IEA, and ND in that order. You should have one bar chart for each aspect, i.e., one for biological process, one for molecular function, and one for cellular component.
- Repeat for all three namespaces with the threshold of 10%.
6. What to Submit
A PDF file on Canvas that contains the following items:
- A pointer to your code that is accessible both by tmmurali@gmail.com and mrumi@vt.edu.
- (40 points) A plot with three stacked bar plots (one for each aspect) at the 1% threshold.
- (40 points) A plot with three stacked bar plots (one for each aspect) at the 10% threshold.
- (10 points) Any observations you have on the results.
- (10 points) Any observations you have on the assignment and the challenges you face.
Grading for items 4 and 5 will be somewhat subjective.