|
Biorithm
1.1
|
|
Biorithm
1.1
|
This manual is for BiVoC, a software package for automatic layout and visualisation of biclusters.
Biclustering has emerged as a powerful algorithmic tool for analyzing measurements of gene expression. A number of different methods have emerged for computing biclusters in gene expression data. Many of these algorithms may output a very large number of biclusters with varying degrees of overlap.
BiVoC is an algorithm for laying out biclusters in a two-dimensional matrix whose rows (respectively, columns) are rows (respectively, columns) of the original dataset. BiVoC displays each bicluster as a contiguous submatrix in the layout. It allows the layout to have repeated rows and/or columns from the original matrix as required, but seeks a layout of the smallest size. BiVoC also includes a simple web-based search interface for the user to query the layout for genes and samples of interest.
BiVoC is part of the Biorithm package, but must be built separately. Before building BiVoC you will need the libGD graphics libraries installed on your computer. On an Ubuntu/Debian-based machine, you can install this package using a command such as
apt-get install libgd2-xpm libgd2-xpm-dev
Download the Biorithm package. Although BiVoC is included in Biorithm, you will need to compile it separately by following these steps:
tar -xvzf biorithm.tar.gz Move to the newly-unpacked BiVoC subdirectory and run the following commands:
cd biorithm-1.1/bivoc
./configure
make
Now the executables should be ready to run.
There are two binaries that must be run in order to use BiVoC: src/layout and src/drawlayout. To use layout, you need an input file containing the biclusters that need to be displayed. The format of this file is the same as the file output by the bicluster miner or the xMotif algorithm included in Biorithm. This file contains one bicluster per line. Each line is tab-delimited and contains the following information: the name of the bicluster, a colour (at the moment, this string is ignored), the list of columns in the bicluster, and the list of rows in the bicluster, all separated by tabs. The format of the bicluster name is <id>_<number of rows>_<number of columns>. The bicluster names should be unique. Since the elements in each line are tab separated, row and column names may contain spaces. For example, you can process the simple example file containing three biclusters found at bivoc/examples/allaml/allaml-3.txt as follows:
src/layout -o examples/allaml/allaml-3.layout examples/allaml/allaml-3.txt
The layout file allaml-3.layout so created stores the row/column orderings of the close-to-optimal layout. Processing this file using the src/drawlayout programme will produce an image according to your specifications. In addition to the layout file, the drawlayout executable requires the file containing the microarray data original microarray data file. The expected format of the microarray data file is a tab-delimited two dimensional array with columns representing samples and rows representing genes. Using the microarray data file in examples/allaml/ALL-AML-all-no-name.txt as an example, to create a postscript image using the default parameters, you can run
src/drawlayout -o allaml-3.ps -a examples/allaml/ALL-AML-all-no-name.txt examples/allaml/allaml-3.layout
If you would like to display the classes associated with the samples in question, you can add the -classes command-line option, as follows:
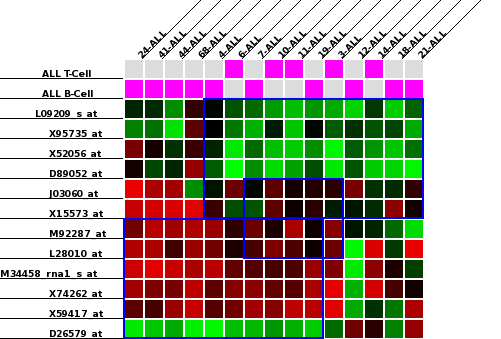
src/drawlayout -o allaml-3.ps -a examples/allaml/ALL-AML-all-no-name.txt examples/allaml/allaml-3.layout -classes examples/allaml/classConvert.txt
The resulting image should look similar to the following:
To see all parameters for both executables, run them with a -h command-line flag. The drawlayout binary is the only one that has optional command line parameters:
| Option | Parameter Type | Description |
|---|---|---|
| -o | filename | Specify output image file. |
| -a | string | Name of Microarray data file. |
| -startSamples | integer | Number of columns before the first data column(default=1). |
| -nameColumn | integer | Number of columns before the column specifying the row names (default=0). |
| -sizeModifier | real | Multiply all dimensions by this value. A value of 2 would make the image twice as tall and twice as wide, effectively quadrupling it's area. |
| -width | real | Multiply bicluster line width by this value in order to make the boxes easier to see. |
| -cr | string | Name of tab-delimited file. Replaces all column names given in the first column of the file with the column names in the second column of the file. |
| -rr | string | Name of tab-delimited file. Replaces all row names in the first column of the file with the row names in the second column of the file. |
| -binary | none | Lets drawlayout know that the microarray input file is binary, not real valued, and draws heat diagram colors accordingly. |
| -colors | none | Draws the bicluster boxes in the color specified in the microarray file(only red,green,blue,black supported). |
| -showColumns | none | Show all columns in the expression file regardless of their presence in a bicluster. |
| -showRows | none | Show all rows in the expression file regardless of their presence in a bicluster. |
| -classes | string | Name of input file. Displays the classes of the samples as specified in the file. |
| -t | string | Specify an output image format. Options are ps,png,gif. ps is the default. |
 1.7.6.1

